Figure 2. Subcellular ChR2-assisted mapping of V1→PM connections to L2/3 PV and Pyr cells.
(a) Coronal slices showing injection (left) and target (right) sites two weeks after the injection of AAV2/1.CAG.ChR2-Venus.WPRE.SV40 into V1. Scale bar, 500 µm. Select target areas indicated in right panel. SC, superior colliculus. (b) Schematic of laser-scanning photostimulation of ChR2-expressing axon terminals during whole-cell recording of a biocytin-filled neuron. TTX and 4-AP are added to the bath solution, and the blue laser is delivered successively one spot at a time in a grid pattern separated by 75 µm. (c) EPSCssCRACM in a PV (left) and a neighboring Pyr (right) cell upon photostimulation. Grey shapes denote the location of the cell body of the recorded neuron. (d) Heat map of mean EPSCs within 75 µs after photostimulation for the EPSCs in 3c. Reconstructions of respective biocytin-filled neurons are superimposed on heat map. (e) Average heat map of 14 neighboring PV-Pyr cell pairs in L2/3 receiving V1→PM input, normalized to largest pixel value between a pair. PV cells receive substantially stronger input. (f) Scatter plot denoting the relative input strengths to 14 PV-Pyr cell pairs. Each data point represents a pair with the respective EPSCs in the PV (vertical axis) and the Pyr (horizontal axis) cell. The total EPSC in PV cells is significantly larger than that in neighboring Pyr cells (p<0.001, Wilcoxon signed-rank test). Solid black line: mean slope, blue line: mean slope after normalizing currents to mean cell conductance. (g) The mean time to peak of EPSCs after photostimulation is larger in Pyr cells than in PV cells (*p<0.05, paired t-test).

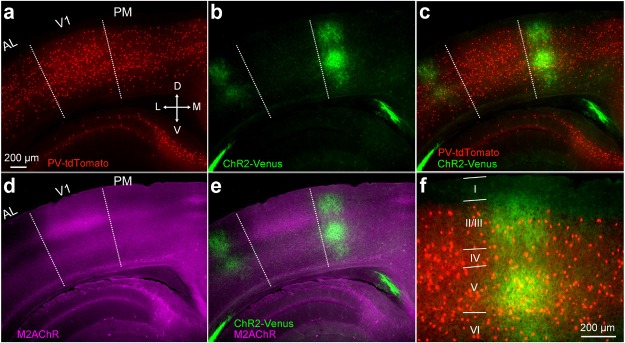
Figure 2—figure supplement 1. V1→PM pathway in a PV-tdT mouse.
Figure 2—figure supplement 2. Paired recordings of excitation-dependent, PV cell-mediated inhibition of Pyr cells.


