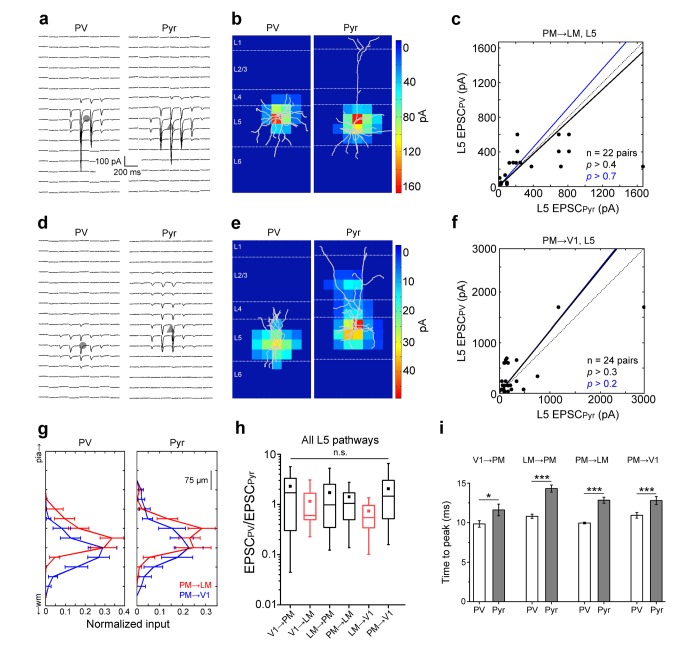
Figure 6. FB input to L5 neurons.
(a) FBPM→LM EPSCssCRACMin a pair of neighboring L5 PV (left) and Pyr (right) cells. (b) Heat map of EPSCs from 7a superimposed with the respective biocytin-filled L5 neurons. (c) Scatter plot of all L5 PV-Pyr neuron pairs receiving input from FBPM→LM. Total EPSC in the two cell types are not significantly different. (d–f) Similar data as 7a-c but for the FBPM→V1 pathway. (g) Total EPSC in each row of the stimulation grid plotted against row position. The grids of the two different pathways are aligned to pial surface. (h) EPSCs in PV cells normalized to EPSCs in neighboring Pyr cells (EPSCPV/EPSCPyr) for all L5 pathways arranged from most FF to most FB. Unlike in L2/3, the EPSCPV/EPSCPyr ratios in L5 are not significantly different in different pathways (p>0.2, Kruskal-Wallis test). Red boxes describe data from Yang et al. (2013). (i) Interareal EPSCs are faster in PV than in Pyr cells in all L5 pathways (*p<0.05, ***p<0.001, paired t-test).

