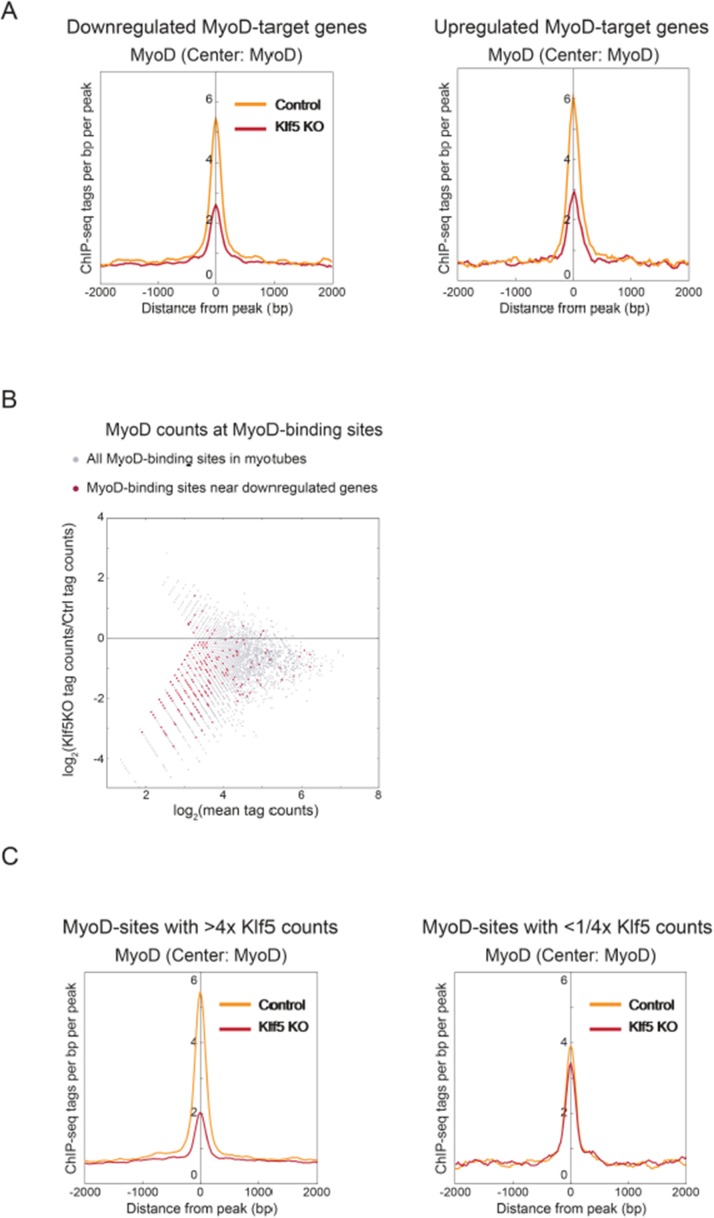
Author response image 1.
(A) Histograms of MyoD tag densities around MyoD binding peaks proximal to MyoD target genes that were upregulated or downregulated (>1.5-fold) by Klf5 deletion. (B) MA plot of normalized tag counts at MyoD biding regions in Klf5 knockout and control cells. MyoD binding regions proximal to genes whose expression was decreased (>1.5-fold) in Klf5 knockout cells as compared with control cells are shown as red dots. (C) Histograms of MyoD tag densities around MyoD binding peaks that had >4-fold increase or decrease in counts nearby (400 bp) Klf5 between day 0 and 5. MyoD densities in Klf5 knockout and control mice are shown.

