. 2016 Sep 13;5:e16761. doi: 10.7554/eLife.16761

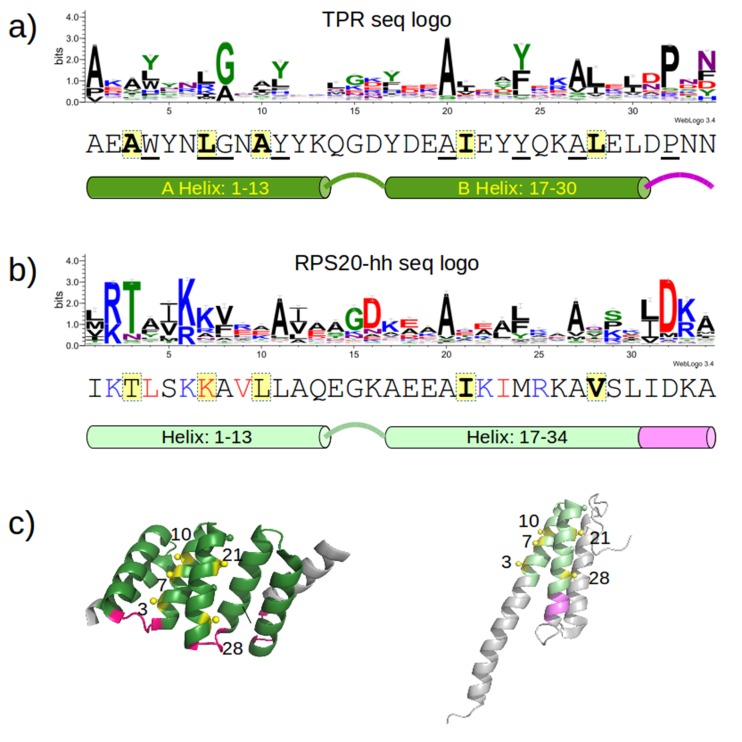
Figure 4. Sequence positions considered for optimizing the designed proteins.

(a) Sequence logo of the TPR motif. A TPR consensus sequence (Main et al., 2003b) (PDB: 1na0, chain A) and its secondary structure determined by DSSP (Kabsch and Sander, 1983) are aligned below the sequence logo. The eight TPR signature positions are underscored in the consensus sequence. The five interface positions are highlighted in yellow. (b) Sequence logo of RPS20-hh. The RPS20-hhta sequence and its predicted secondary structure using Quick2D (Biegert et al., 2006) is aligned below the sequence logo. The derived interface positions are highlighted in yellow. The four residues subjected to mutations are colored in red. The four positively charged residues selected for mutation to lower the surface charge are in blue. (c) The locations of the interface positions displayed on a TPR (left) and a RPS20 structure (right). In both structures, the interface positions are labeled and highlighted as yellow spheres. The TPR structure is CTPR3 (PDB: 1na0, chain A), which is shown as a cartoon and is colored using the same scheme as the secondary structure representation in (a). The stop helix is in gray. The RPS20 structure is from T. thermophilus (PDB: 4gkj, chain T), in which the RPS20-hh fragment is colored using the same scheme as the secondary structure representation in (b). The sequence logos were generated using WebLogo (Crooks et al., 2004). Sequences from representative proteome 75% (Chen et al., 2011) downloaded from Pfam families TPR_1 and Ribosomal_S20p were used as input to WebLogo (9338 and 972 sequences, respectively). The structures were rendered using PyMOL (Schrödinger, 2010).

DOI: http://dx.doi.org/10.7554/eLife.16761.009

Figure 4.

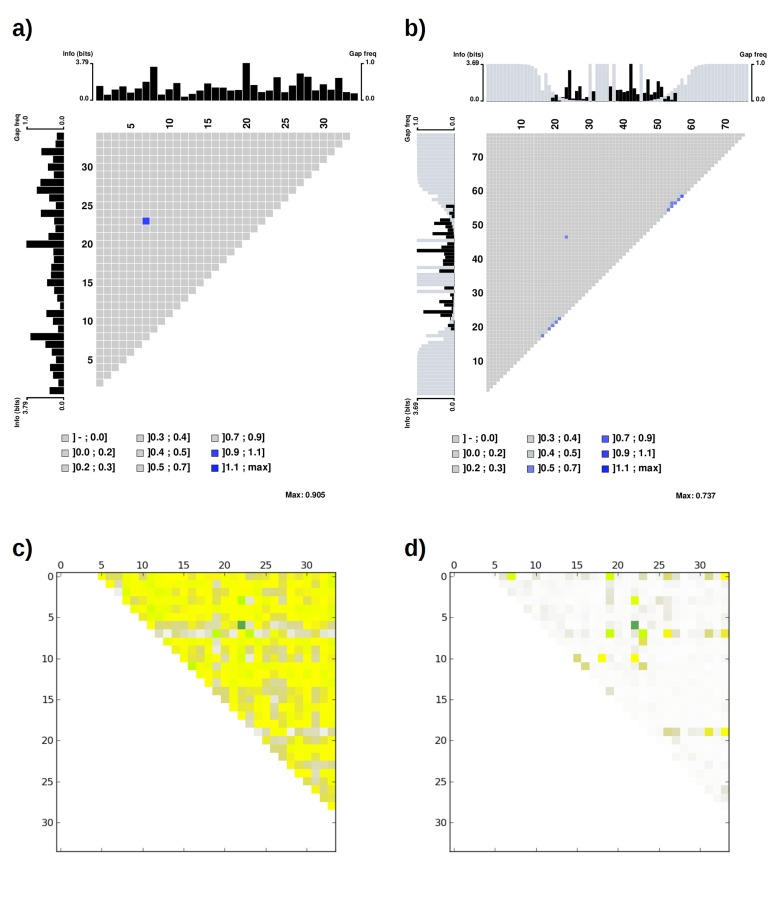
Figure 4—figure supplement 1. Mutual information plot (a and b) and direct coupling analysis plot (c and d) for TPR repeat sequences.

Figure 4—figure supplement 1.

The subfigures (a) and (c) were generated using the seed alignment sequences from Pfam family TPR_1 (558 sequences. Sequence Q29585_PIG/28–61 was removed as it contains unknown residue X). The largest mutual information value is observed between position 7 and 23. The subfigures (b) and (d) were generated using the multiple alignment of representative proteomes rp75 sequences from Pfam family TPR_1 (9338 sequences). The largest non-local mutual information value was observed between position 24 and 47, corresponding to position 7 and 23 using TPR repeat numbering. Alignments were taken from Pfam 27.0. Subfigures (a) and (b) were generated using MatrixPlot. Subfigures (c) and (d) were generated using DCA Workbench (http://dca.rice.edu/portal/dca/workbench).
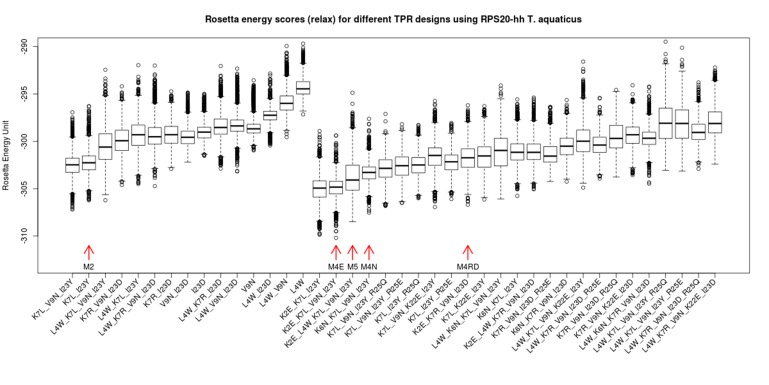
Figure 4—figure supplement 2. Rosetta energy scores (fixbb+relax) for TPR designs based on RPS20-hhta sequence and various sets of mutations.

Figure 4—figure supplement 2.

The scores for the designs are shown in two groups: the group to the left are combinations involving only primary mutations (see Supplementary file 1E). The group to the right are designs involving both primary and secondary mutations (Supplementary file 1E). The design variants are sorted by the average of the lowest 10% scores. The designs tested in the lab are marked by red arrows (M2, M4E, M5, M4N, M4RD). The in silico simulation was performed using Rosetta 3.4.
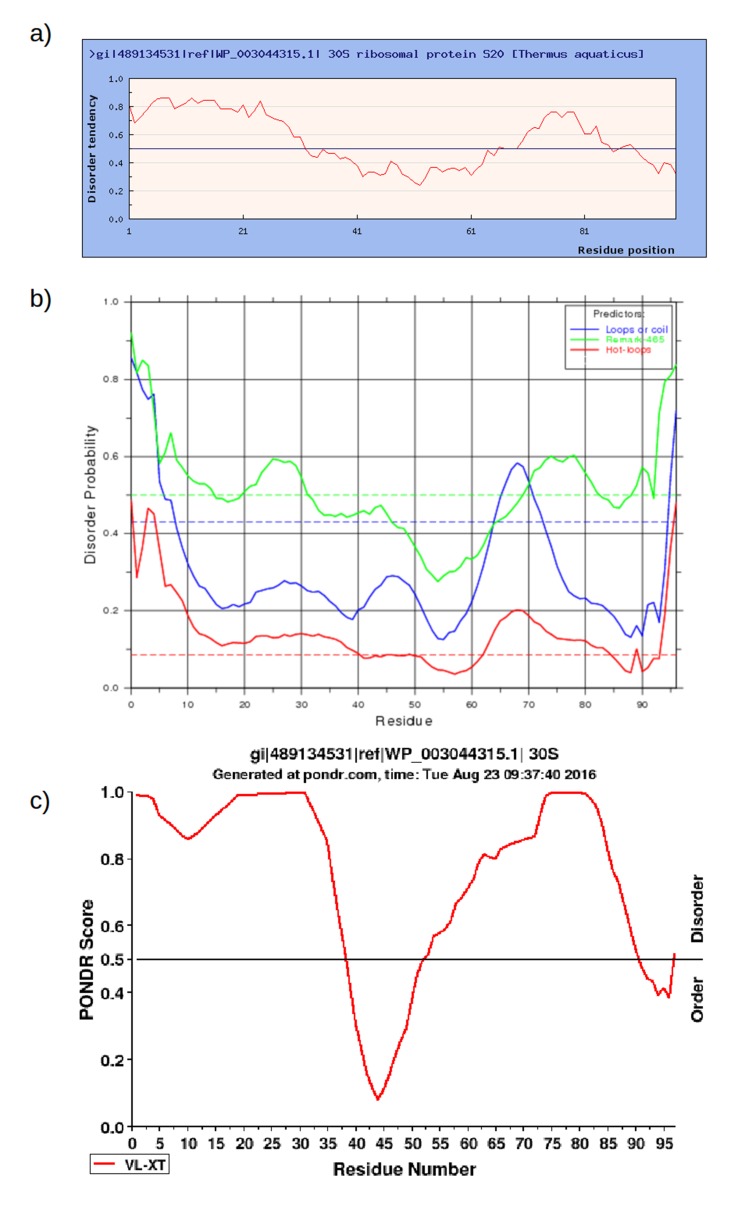
Figure 4—figure supplement 3. Prediction of intrinsically disordered regions in RPS20 of Thermus aquaticus (NCBI gi: 489134531, accession: WP_003044315.1) using a) IUPred (http://iupred.enzim.hu/); b) DisEMBL (http://dis.embl.de/) and c) PONDR (http://www.pondr.com/).

Figure 4—figure supplement 3.