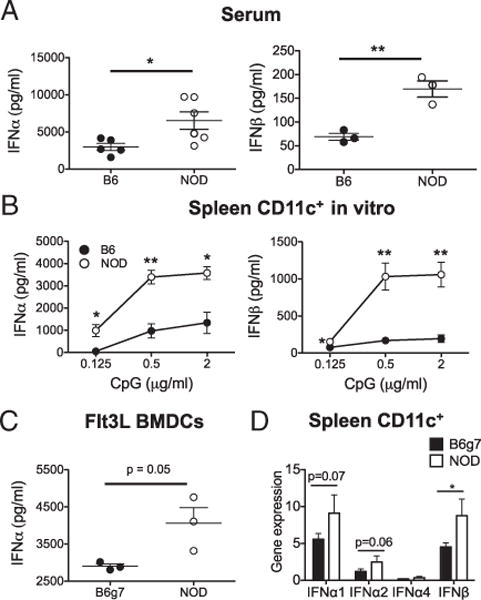
FIGURE 1.

NOD mice show higher expression of type 1 IFN in response to CpG. Type 1 IFN levels were measured 6 h post-CpG stimulation by ELISA in serum samples of NOD and B6 mice 6 h post CpG treatment (A), culture supernatant of enriched-splenic DC culture (B), and culture supernatant of Flt3L-BMDC (C). (D) Type 1 IFN gene expression in CD11c+-enriched population measured by quantitative PCR. Data presented in this paper are from one of at least two to four independent experiments. Comparisons were made between NOD and B6 (A and B) or B6g7 (C and D). *p < 0.05, **p < 0.01.
