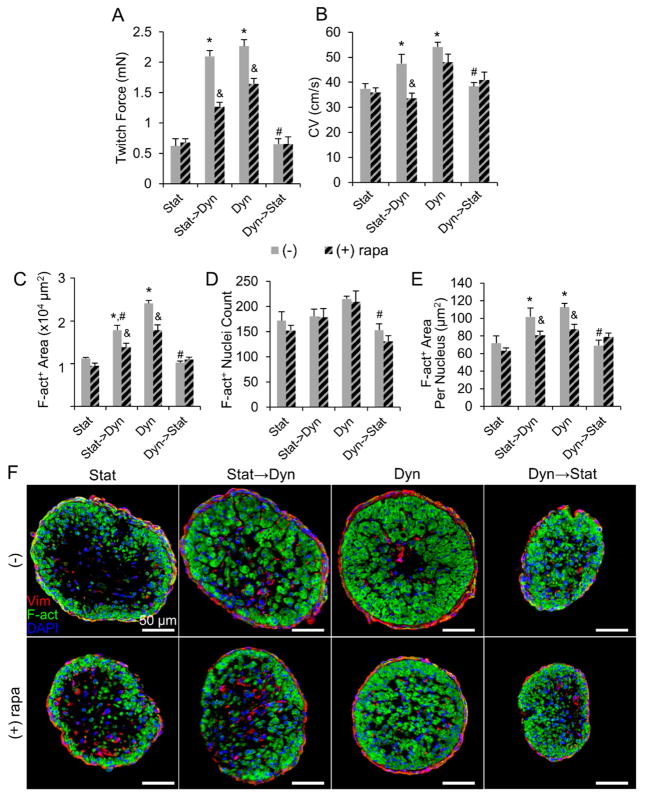
Figure 7. Effects of mTORC1 inhibition on structure and function of NRVM cardiobundles.
(A–B) Max twitch forces (A) and CV (B) in cardiobundles switched from static to dynamic culture (Stat→Dyn) or from dynamic to static culture (Dyn→Stat) at culture day 7. (Stat) and (Dyn) denote static- and dynamic-only culture for 14 days. Cardiobundles were cultured with or without the mTORC1 inhibitor rapamycin (500 nM, rapa, diagonally patterned bars) (n = 10–13 cardiobundles per group from 3 cell isolations). (C–E) F-actin+ area (C), nuclei count (D) and F-actin+ area/nuclei (E) in cardiobundle cross-sections (n = 6–8 cardiobundles per group from 2 cell isolations). (F) Representative cross-sections stained for vimentin (Vim, red), F-actin (F-act, green), and nuclei (DAPI, blue). *, p < 0.05 vs. static at the same culture point; #, p < 0.05 vs. dynamic at the same culture point; &, p < 0.05 vs. corresponding non-rapamycin control.

