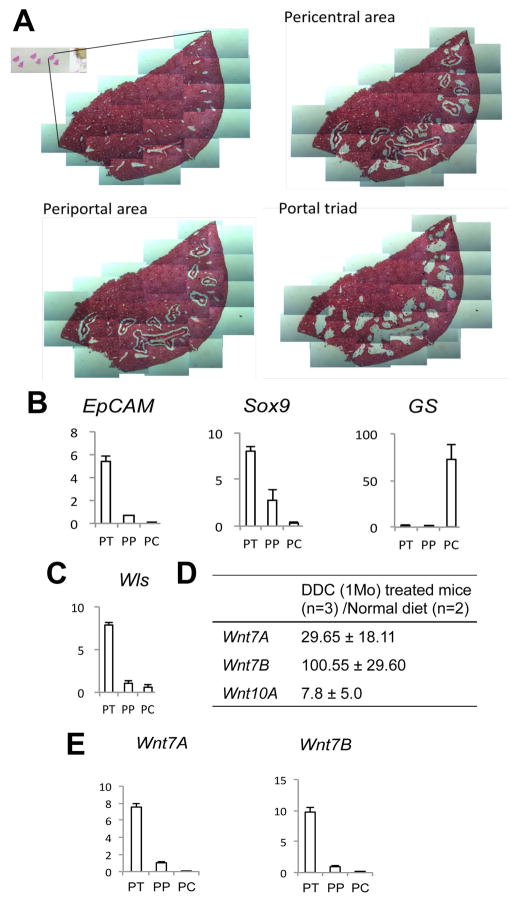
Figure 1. Spatial analysis of Wls and Wnts after DDC diet.
(A) Periportal (PP), pericentral (PC), and portal triad (PT) areas were dissected from H&E-stained frozen liver sections. (B) Expression of periportal and pericentral markers is shown by qRT-PCR. (C) Wls expression was detected mainly in the PT region, as shown by qRT-PCR. (D) Wnts 7A, 7B, and 10A were dramatically upregulated in the livers of DDC-fed mice compared to controls. (E) Expression of Wnt7A and Wnt7B was detected in the PT after DDC diet.

