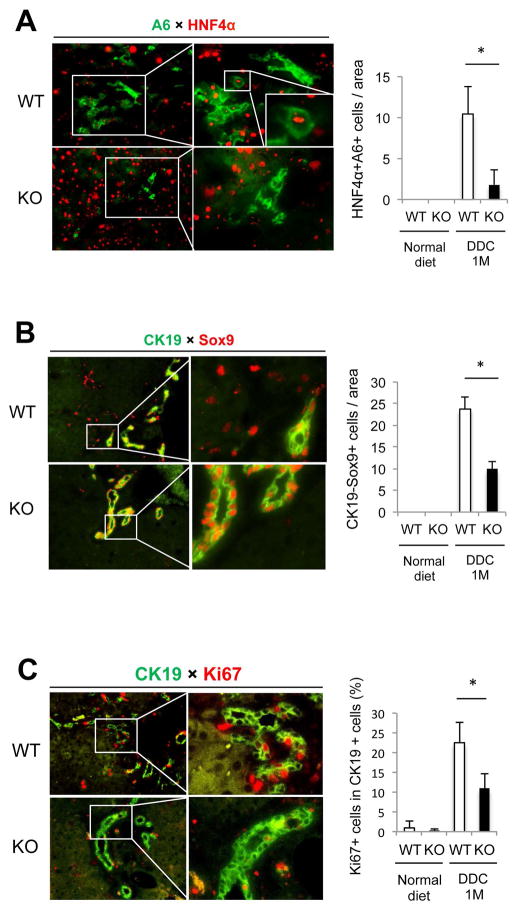
Figure 7. Cholangiocyte proliferation and hepatocyte-to-cholangiocyte transdifferentiation are disrupted in Wls KO after DDC diet.
(A) Representative images of WT and KO livers stained for biliary marker A6 (green) and hepatocyte marker HNF4α (red) are shown. Many large hepatocytes expressing A6 are seen in WT after DDC treatment, whereas the number of A6+HNF4α+ cells was significantly decreased in KO. (B) Representative images of WT and KO livers stained for biliary marker CK19 (green) and Sox9 (red) are shown. The presence of CK19 negative cells expressing Sox9, which is indicative of incompletely differentiated cholangiocytes derived from transdifferentiating hepatocytes, is significantly higher in WT than in KO after DDC treatment. (C) Representative images of WT and KO livers stained for CK19 (green) and proliferation marker Ki67 (red) are shown. The number of proliferating cholangiocytes is higher in WT after DDC treatment than in KO. * p < 0.05. Images taken at 100×; magnifications are 400×.

