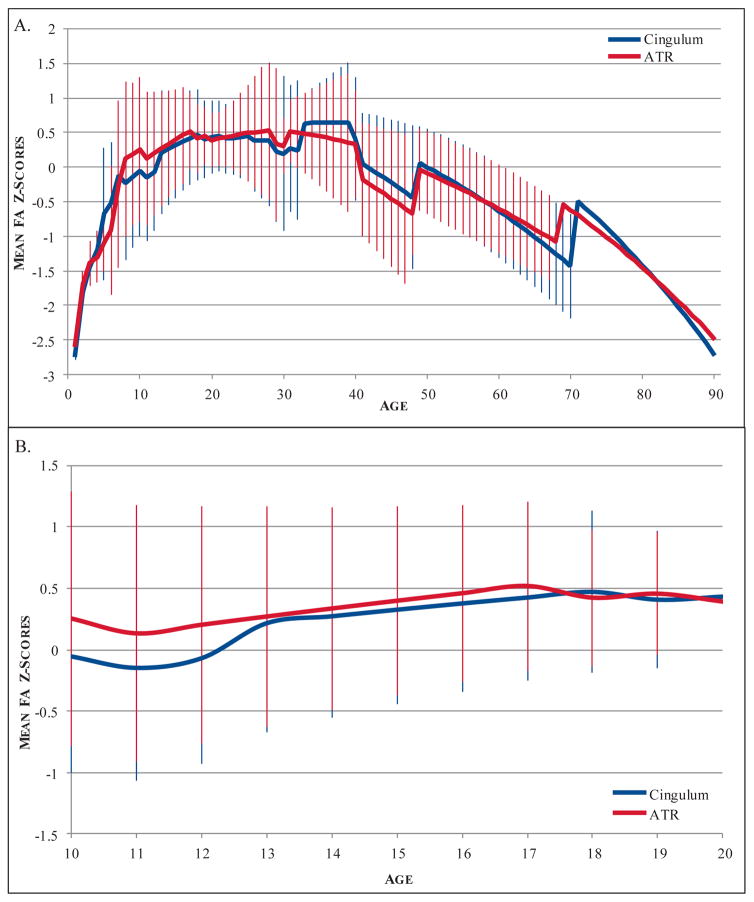
Figure 3.
Developmental trajectories of cingulum and ATR fractional anisotropy. A) Lifetime developmental trajectory of FA from age 0–90. B) Trajectory of FA across adolescence, age 10–20. Lines represent mean FA z-scores from all models included. Because the composite model predictions combine both linear and quadratic effects, both linear and quadratic models are displayed. Error bars depict standard deviations.

