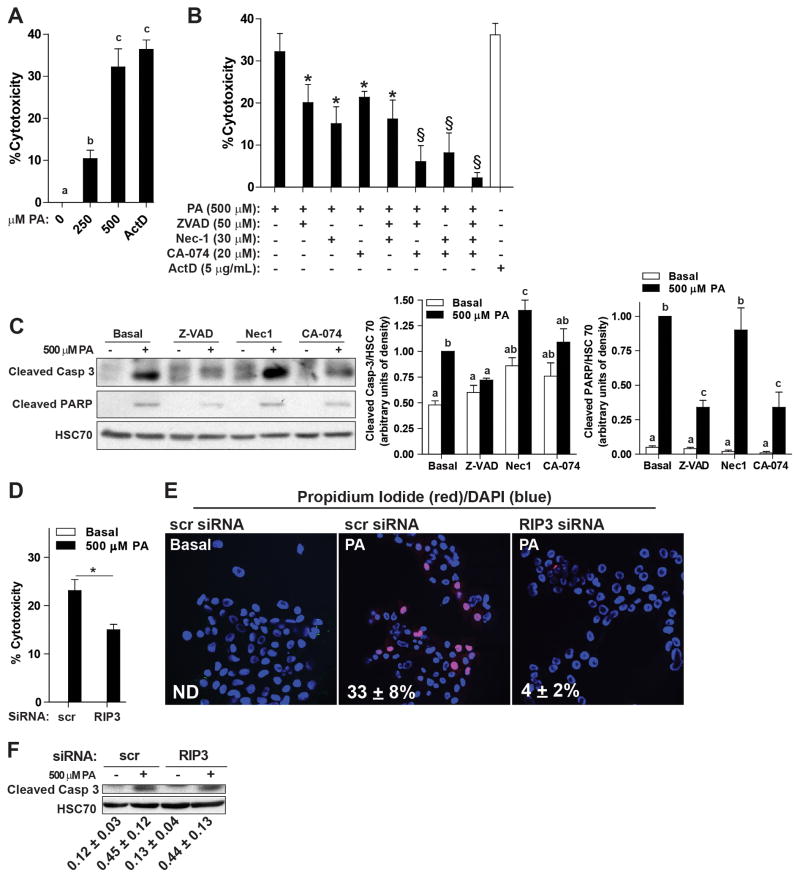
Figure 7. Palmitic acid-induced lipotoxicity occurs via multiple cell death pathways in hepatocytes.
AML12 hepatocytes were pre-treated with or without 50 μM Z-VAD, 30 μM necrostatin-1 or 20 μM CA-074 for 2 h and then challenged with or without palmitic acid for 14 h. (A) Culture with palmitic acid dose-dependently increased cytotoxicity, assessed by MTS assays. Actinomycin D-treated cells were used as a positive control. (B) Pre-treatment with Z-VAD, necrostatin-1 or CA-074 decreased palmitic acid-induced cytotoxicity. *p<0.05 compared to palmitic acid alone; §p<0.05 compared to cells treated with a single inhibitor. n=4 independent experiments. (C) Western blot analysis of the cleavage products of caspase-3 and PARP were measured in lysates of AML12 cells pre-treated with or without Z-VAD, necrostatin-1 or CA-074 and then challenged with 500μM palmitic acid for 22 h. HSC70 was used as a loading control. (D/E/F) AML12 hepatocytes were transfected with scrambled siRNA or siRNA targeted to knock-down RIP3. 24h after transfection, cells were challenged with or without 500 μM palmitic acid. (D) Cytotoxicity was assessed by MTS assay. Actinomycin D was used as a positive control for cytotoxicity. (E) Propidium iodide (red) staining was evaluated by live cell imaging. PI positive cells were counted in 5 images and expressed relative to the total DAPI (blue) positive cells. (F) Western blot analysis of cleaved caspase-3 was measured in lysates. (D/E/F) *p<0.05, n=4.

