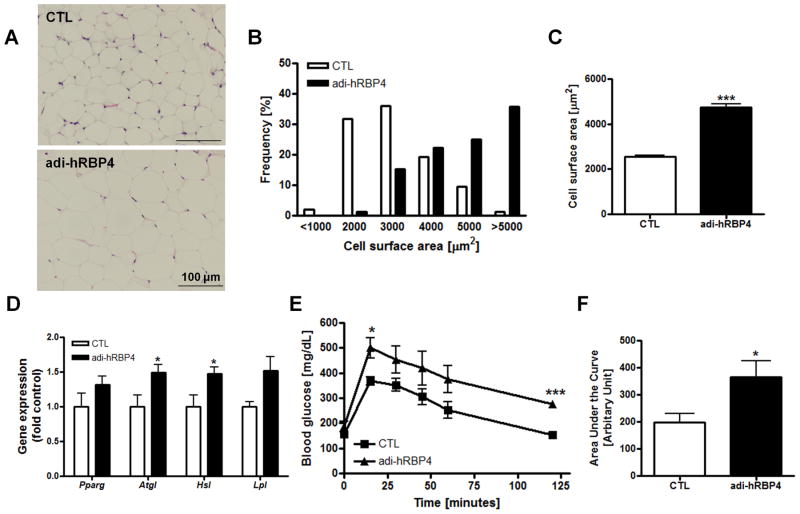
Figure 2. Adipocyte physiology and glucose metabolism are altered in adi-hRBP4 mice fed a chow diet.
(A) Representative hematoxylin and eosin (H&E)-stained sections for visceral adipose tissue. Bars represent 100 μm. Frequency distribution of adipocyte cross-sectional areas (B) and mean cross-sectional areas of adipocytes (C). Greater than 100 cells were measured for each of 2 adi-hRBP4 and 2 littermate control mice. (D) mRNA expression of genes encoding lipolysis-related proteins in visceral fat as determined by qT-PCR; n = 6 - 7. All data are normalized to 18S rRNA. *, P < 0.05 versus controls (CTL). (E) Glucose tolerance tests (GTT) and (F) the area under the curves (AUCs) (intraperitoneal injection of 2g/kg body weight; 6 h after food removal) (n = 5 - 13). *, P < 0.05 versus controls (CTL). Data are presented as means ± SEM.

