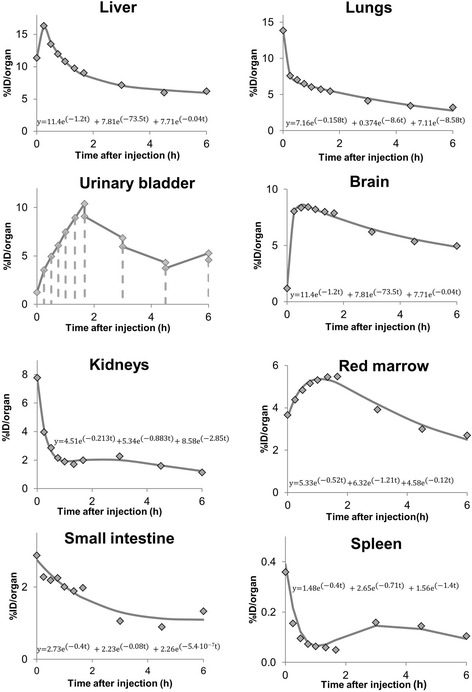
Fig. 2.

Exemplary time-activity curves of one human subjects and the respective exponential fit functions for different organs. For the urinary bladder, combined image and urine sample activity concentration data were used and the number of disintegrations is determined using the trapezoidal fit
