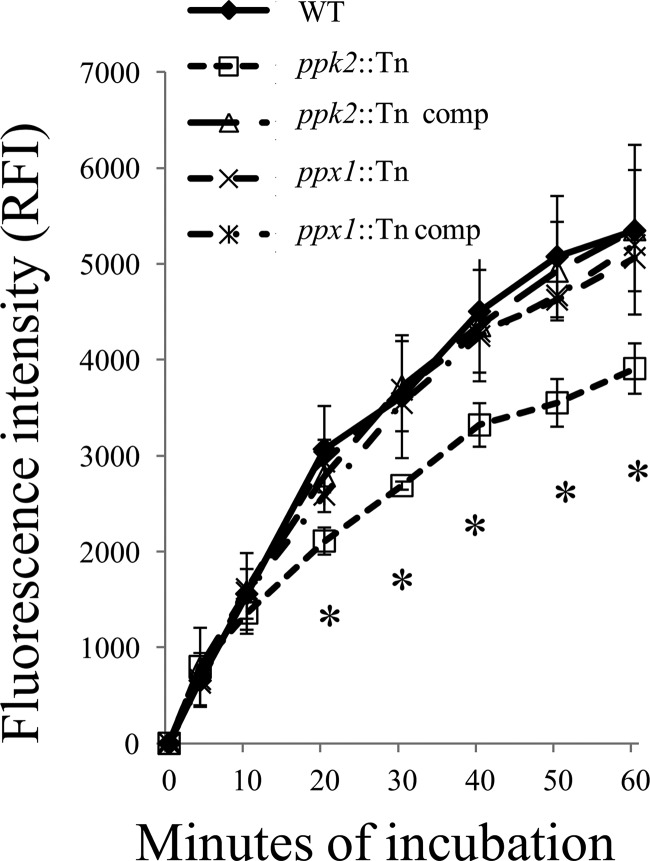
FIG 4.
Decreased Nile red staining in the ppk2-deficient mutant. Each strain was grown to mid-log phase and stained with 20 μM Nile red. The fluorescence intensity was normalized to the initial signal. Data represent mean values ± SDs for three biological replicates. *, P < 0.05 when comparing ppk2::Tn mutants to the wild type or the pp2::Tn Comp strain. RFI, relative fluorescence intensity.

