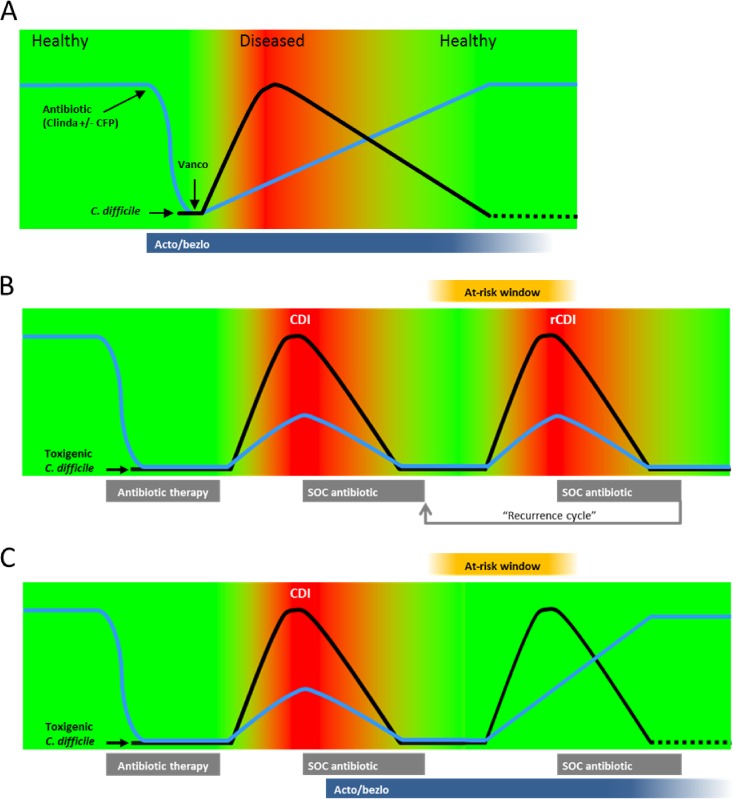
FIG 6.
Models of progression and resolution of disease in CDI. (A) Schematic representation of disease progression and resolution in rodent models of CDI based on data from this study. Green areas represent lack of symptomatology; red areas represent the presence of symptomatology. The blue line represents the state of the gut microbiota; the black line represents C. difficile burden. Times of clindamycin/cefoperazone [Antibiotic (Clinda ± CFP)], vancomycin (Vanco), and acto/bezlo (Acto/bezlo) administration, and of C. difficile challenge, are indicated. (B) Model of primary and recurrent CDI progression and resolution in humans. Colors and lines are per panel A. Relative times of administration of CDI-causing broad-spectrum antibiotics (“Antibiotic therapy”) and of standard-of-care CDI therapy (“SOC antibiotic,” representing vancomycin, metronidazole, or fidaxomicin) are indicated. “At-risk window” box indicates the periods of susceptibility to recurrent CDI due to sustained dysbiosis following administration of SOC antibiotics. “Recurrence cycle” arrow indicates potential repeat episodes of recurrent CDI (rCDI). (C) Per panel B legend but in the context of acto/bezlo (“Acto/bezlo”) treatment during a primary episode of CDI, leading to protection against recurrent CDI throughout the at-risk window.

