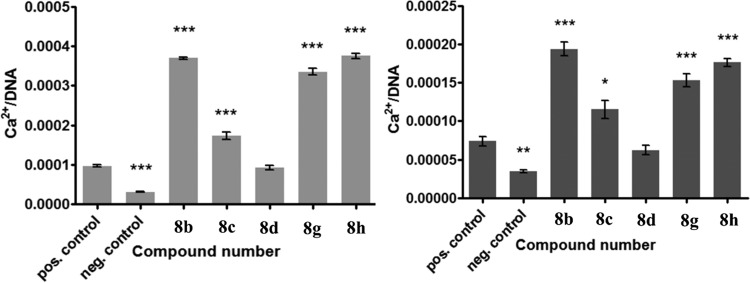
FIG 7.
Effect of selected compounds (12.5 μM) on the osteogenic differentiation potential of MSC (left) and OB (right) after 5 and 3 weeks of exposure, respectively, as determined by measuring the calcium content, which was normalized by the amount of DNA. Bars and error bars represent the means and standard errors from at least four repeats, respectively. The negative control contains no osteogenic supplements. The solvent (positive) control contains osteogenic supplements and a 0.5% ethanol background. Significant differences (*, P < 0.05; **, P < 0.01; ***, P < 0.001) from the results for the solvent control are indicated. pos., positive; neg., negative.

