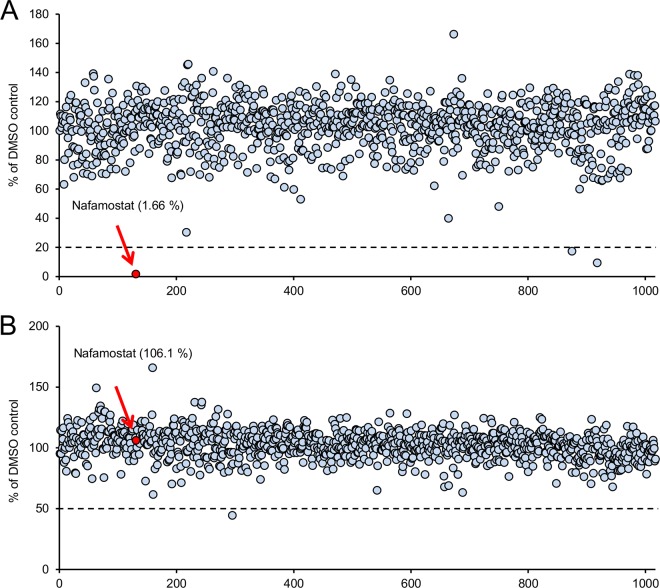
FIG 3.
The results of the high-throughput screening (HTS) of 1,017 FDA-approved drugs in the DSP assay for MERS-S. Results of screening of 1,017 drugs using the HTS DSP assay are shown. (A) The vertical axis shows the reading of the DSP activity (RL activity) for the tested drugs (1 μM). The RL values were normalized to the control, which contained DMSO only. The horizontal axis shows the identification number arbitrarily assigned to each drug. Each dot represents an individual drug. The dotted line indicates 20% of the control value. The value determined for the most active drug, nafamostat (1.66% of the control value), is indicated with a red arrow and red dot. (B) The effect of each drug on RL activity itself. To rule out the nonspecific direct inhibitory effect of each drug on the RL activity itself, each drug (1 μM) was applied to the cells coexpressing both DSP1-7 and DSP8-11, which harbored reassociated active DSP. The results are shown as in panel A. The value for nafamostat (106.1% of the control value) is indicated with a red arrow and red dot.

