FIG 2.
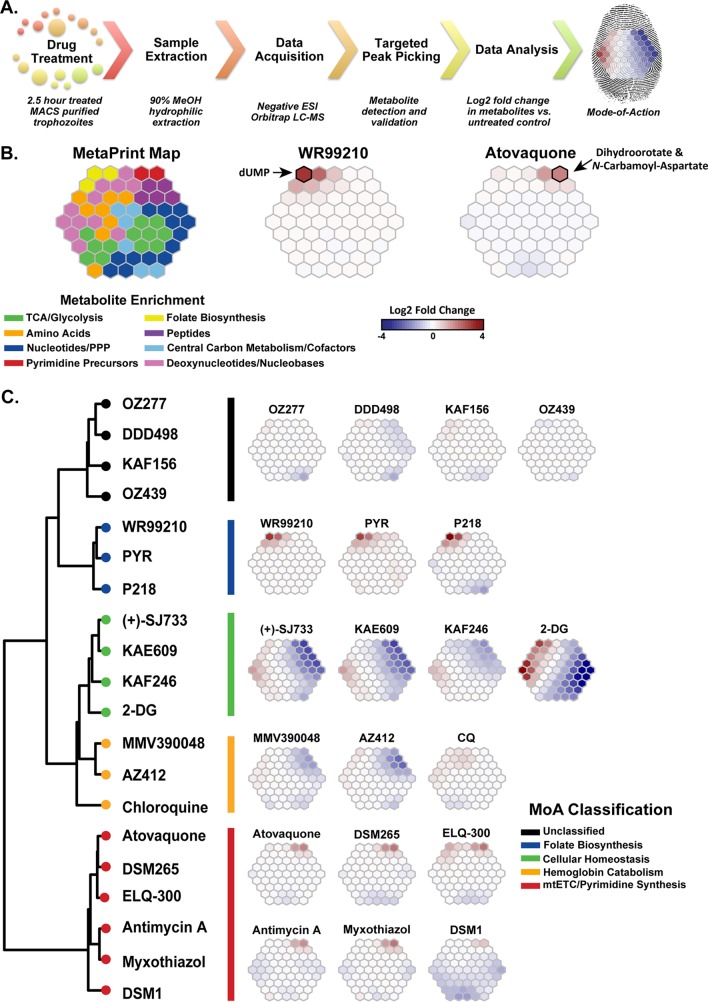
Metabolomic fingerprint analysis of validated compounds with antimalarial activity. (A) Experimental metabolomic profiling pipeline used for all validation and MMV Malaria Box experiments, based on parameters determined from results shown in Fig. 1. (B) Metabolomic profiling was used to measure the parasite metabolic response following drug treatment (see Table S2 in the supplemental material). The data were analyzed using self-organizing maps and are displayed as a suprahexagonal (66) metabolic fingerprint or metaprint. Metabolite clusters were associated with eight generalized metabolic pathways using the KEGG database and were color coded within the suprahexagon base map (left). Metaprints for both atovaquone and WR99210 are displayed as examples, with specific signature metabolites denoted (right). (Mapping locations for all metabolites can be found in Table S3.) (C) We assembled metaprints (right) and clusters (Pearson-Ward distance-clustering) (left) based on the metabolomic profiles for each compound, as determined from the log2 fold change values of targeted metabolites following drug treatment relative to an untreated (no-drug) control (see Table S2). MoA classifications were performed based on a combination of clustering, metaprint analysis (right), and a priori biochemical knowledge (Table 1). Pyr, pyrimethamine; 2-DG, 2-deoxyglucose; CQ, chloroquine.

