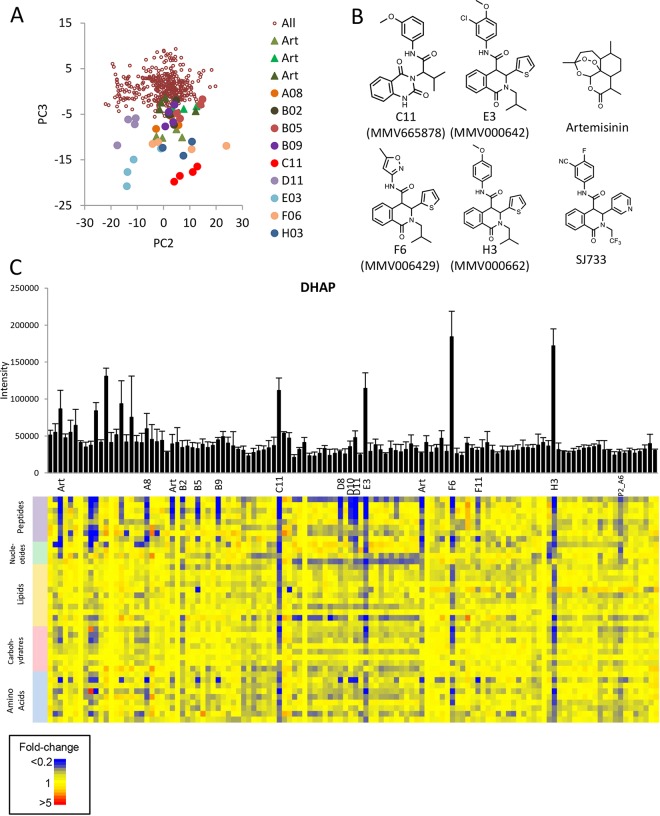
FIG 3.
(A) Principal-component analysis (PCA) scatterplot of PC2 versus PC3 built using all LC-MS metabolite data from all samples (excluding pooled biological quality controls and blanks). Artemisinin samples, from three separate experiments, are represented by triangles, and other compounds with low scores on PC3 are represented by large filled circles. (B) Structures of artemisinin, SJ733, and the four Malaria Box compounds that showed the greatest impact on metabolism in this study. (C) Relative intensities (mean peak height + standard deviation) of DHAP in all samples and a heat map of the 40 most significantly perturbed metabolites in principal component 3 (loadings > 0.06).

