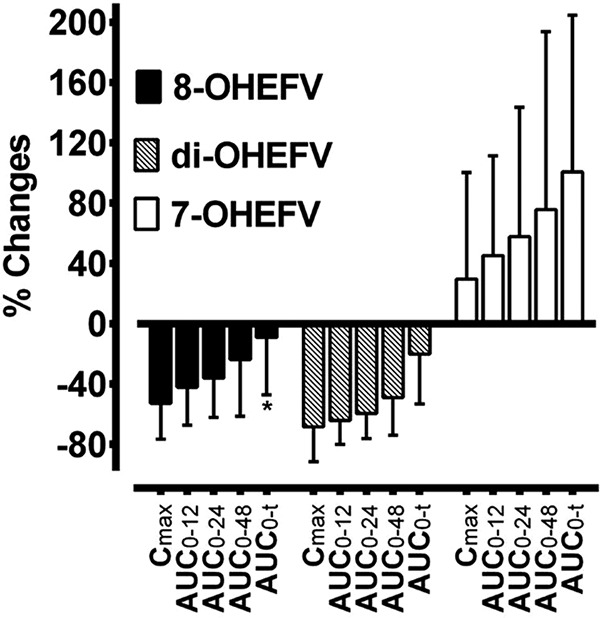
FIG 2.

Percent changes in maximum concentration (Cmax) and partial area under the plasma concentration-versus-time curve (AUC) of efavirenz (EFV) metabolites in healthy volunteers after a single 100-mg oral dose of EFV without (control) and with voriconazole treatment to steady state. Percent changes of 8-hydroxy-EFV (8-OHEFV), 7-OHEFV, and di-OHEFV were calculated as 100 × (voriconazole − control)/control. Except for changes in AUC0–t of 8-OHEFV and Cmax of 7-OHEFV, which did not reach a statistically significant level, all other parameters were significantly altered by voriconazole (P < 0.05).
