Fig. 1.

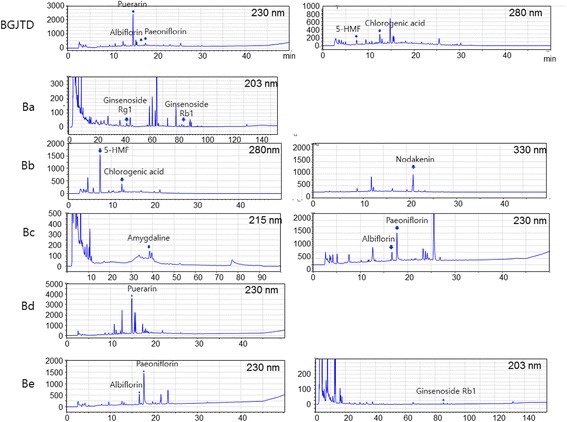
HPLC profile of BGJTD and its subgroup extracts. Peaks that coincide with standard chemical solutions are marked by vertical arrows, and UV values applied to detect peaks are indicated in the figure

HPLC profile of BGJTD and its subgroup extracts. Peaks that coincide with standard chemical solutions are marked by vertical arrows, and UV values applied to detect peaks are indicated in the figure