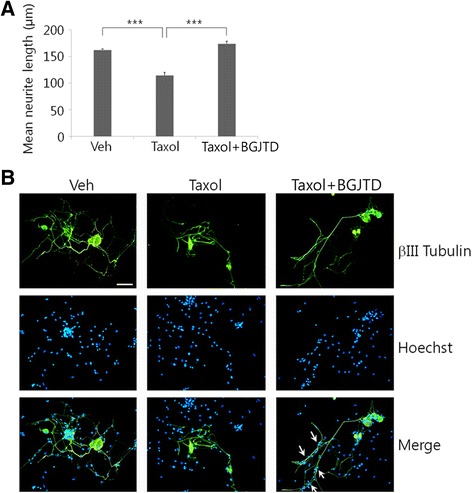
Fig. 3.

Effects of BGJTD on the neurite outgrowth of DRG neurons. a Quantitative comparison of neurite outgrowth. b Representative images of DRG neurons co-cultured with Schwann cells. The neurites were visualized by immunostaining with anti-βIII tubulin antibody (green), and the distribution of co-cultured Schwann cells were identified by Hoechst nuclear staining (blue). In (a), neurite length was determined by analyzing more than 20 neurons in 7–10 random microscopic fields, averaged 4 independent experiments, and compared among experimental groups. Error bars denote standard error of mean (SEM). ***p < 0.001 (One-way ANOVA, number of independent experiments = 4). Scale bar: 50 μm
