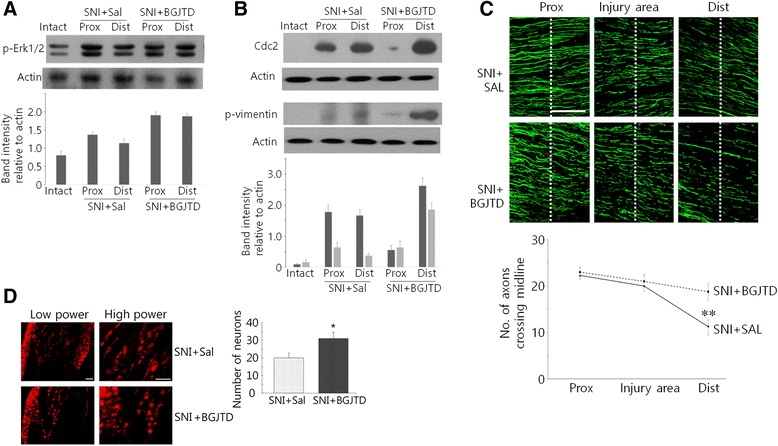
Fig. 6.

Effects of BGJTD treatment on the axonal regeneration after nerve injury. a Western blot analysis of phospho-Erk1/2 after sciatic nerve injury (SNI) and BGJTD treatment. b Western blot analysis of Cdc2 and phospho-vimentin in the sciatic nerve after injury (SNI) and BGJTD treatment. In (a) and (b), western blotting images are the representatives from 2–3 independent experiments. Quantitation of protein band intensity relative to actin control are shown in lower panels. c Distribution of axons in the sciatic nerve after crush injury. Axons were visualized in the proximal, injury, and distal stumps (6 mm each) in the longitudinal sections by immunofluorescence staining for NF-200. (Lower) Number of axons crossing midline (dotted) are counted from each images, averaged from nonconsecutive sections from each animal, and compared between experimental groups (One-way ANOVA, **p < 0.01, number of animals = 4). d Retrograde tracing of DiI-labeled sensory neurons in the DRG (left). Quantitative comparison of DiI-labeled DRG neurons between saline-and BGJTD-treated groups (right).*p < 0.05 (Student’s t-test, number of independent experiments = 4). Scale bars in (c, d): 100 μm
