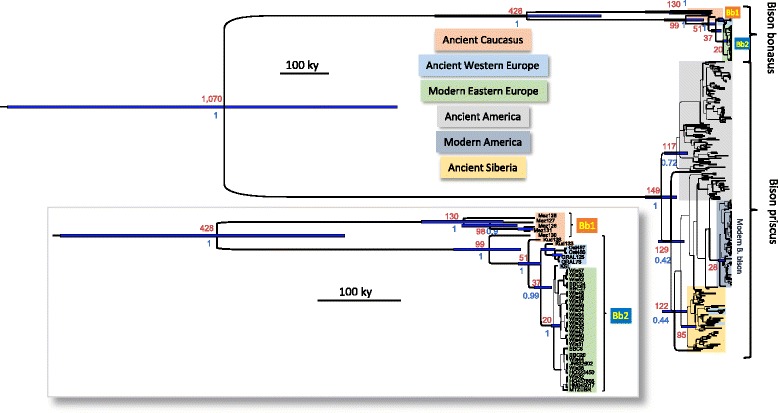
Fig. 2.

Bayesian phylogeny of Bison hypervariable region. All dated and complete ancient Bison sequences produced here and in a previous B. priscus analysis [7] were aligned and reduced to the 367 bp sequence targeted herein alongside modern B. bonasus and B. bison sequences. A Bayesian phylogenetic analysis was performed using Beast to estimate the age of the nodes from temporally spaced sequence data. The age of the nodes (in kya) is indicated in red, whereas the blue bars represent the 95 % highest posterior density interval of these ages. The color code representing the origin of the various samples is as indicated. The inset on the lower part of the figure represents a magnified view of the B. bonasus branches of the tree. The posterior probability of the nodes is indicated in blue and the thickness of the branches is proportional to this posterior probability
