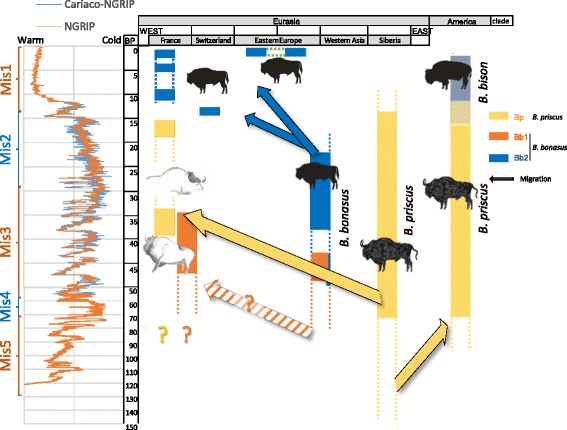
Fig. 4.

Schematic representation of the distribution through time and space of the various mitogenome clades. The geographic regions are represented on the abscissa and the time scale on the ordinate. The ascertained presence of the various mitochondrial haplogroups are represented by solid boxes, whereas the dotted lines indicate possible temporal extension of the presence of these clades. The left side shows the climatic fluctuations as inferred from the North Greenland Ice Core Project (NGRIP) [25] and the combined Caribbean Cariaco basin and NGRIP data as shown in [12], as well as the Marine Isotope Stage (MIS) as defined by Lisiecki and Raymo [24] (http://www.lorraine-lisiecki.com/LR04_MISboundaries.txt). The proposed migrations are indicated by solid arrows. The hatched arrow indicates a possible migration of the Bb1 clade that populated Western Europe from a southern refugee before the time period analyzed herein. The genetic identity of the bison that, according to the fossil record, populated Western Europe prior to 60 kya is not known, but climatic fluctuations may have triggered additional expansions and contractions of different populations of B. priscus and B. bonasus. (Drawings: E-M Geigl)
