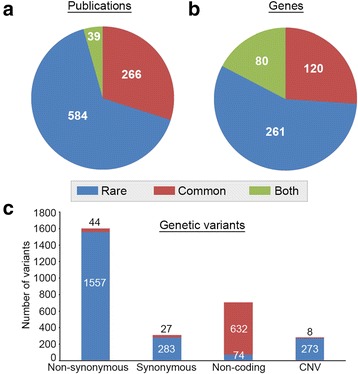
Fig. 1.

Global overview of the data in this study. a A pie chart showing the number of publications reporting only common (red), rare (blue), or both common and rare (green) genetic variants associated with autism spectrum disorder (ASD) in our database. b A pie chart showing the number of genes including only common (red), rare (blue), or both common and rare (green) genetic variants associated with ASD in our database. c A distribution of the common (red) and rare (blue) genetic variation in our database within four mutation categories: nonsynonymous, synonymous, non-coding, and copy number variations (CNVs)
