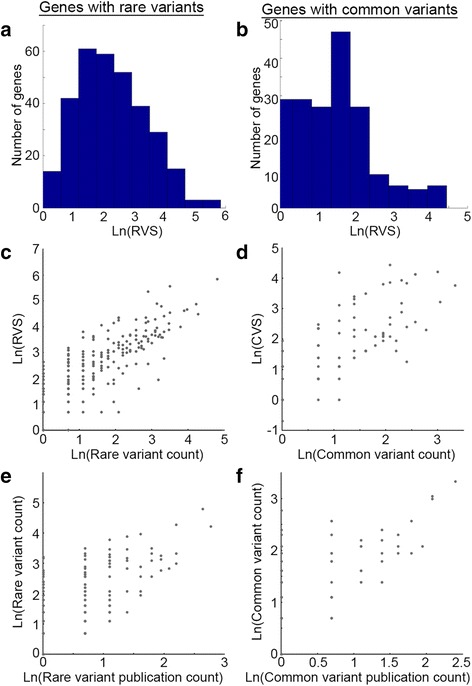
Fig. 2.

Distributions of rare variant scores (RVS) and common variant scores (CVS). The distributions of the natural logarithm of genes’ RVS and genes’ CVS are depicted as histograms (a, b, respectively), and as a function of variant counts (c, d for rare and common variants, respectively). Both RVS and CVS are significantly correlated with the number of variants per gene (r = 0.84 and r = 0.70, respectively; p < 0.0001). e, f The obvious association between the number of variants and the number of publication per gene (r = 0.70 and r = 0.69, respectively; p < 0.0001)
