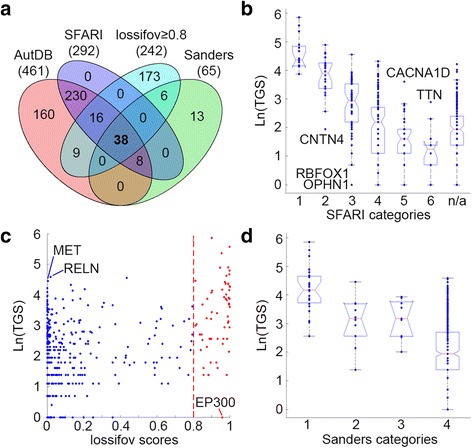
Fig. 4.

A comparison to other ASD risk genes datasets. a Venn diagram of the 653 ASD risk genes included in AutDB, SFARI gene scoring module [22], Iossifov et al. [23], and Sanders et al. [11]. b A distribution of TGS across the different categories of genes in the SFARI gene scoring module (1 = “high confidence”; 2 = “strong candidate”; 3 = “suggestive evidence”; 4 = “minimal evidence”; 5 = “hypothesized”; 6 = “not supported”). c A scatterplot comparing the TGS of the genes in AutDB to their corresponding posterior probabilities in Iossifov et al. [23]. Genes with posterior probabilities ≥0.8 are highlighted in red. d A distribution of TGS across the different categories of genes reported in Table 4 of Sanders et al. [11]. Categories indicate the probability pf genes to be ASD risk genes (1 = FDR ≤ 0.01; 2 = 0.01 < FDR ≤ 0.05; 3 = 0.05 < FDR ≤ 0.1; 4 = 0.1 < FDR
