
Fig. 5.
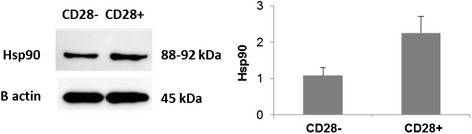
a. Representative Western Blot of equal numbers of sorted CD28+ and CD28null T cells, stained for Hsp90 expression. There was a decrease in the 90 kDa band corresponding to the Hsp90 in CD28null T cells compared with CD28+ T cells. b. Bar graph showing Hsp90 expression relative to β-actin from CD28 null (CD28−) and CD28+ T cells (mean ± sem from 3 experiments)