Fig. 2.

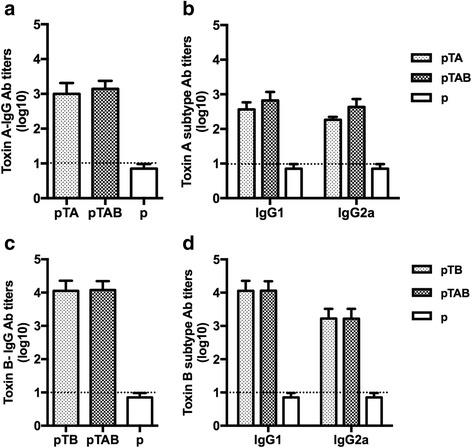
ELISA detection of anti-TcdA/B antibody titers. The data are expressed as geometric mean titer (GMT) of TcdA-specific antibody ± standard deviation (SD) of 10 mice per group. The lower limit of detection (1:10) is shown as dotted lines. The experiment was repeated at least twice. a TcdA-specific IgG antibody responses in mouse sera collected at 7 days after each vaccination. b: TcdA-specific IgG1 and IgG2a antibody responses in mouse sera obtained 7 days after the last boost. c TcdB-specific IgG antibody responses in mouse sera collected at 7 days after each vaccination. d TcdB-specific IgG1 and IgG2a antibody responses in mouse sera obtained 7 days after the last boost
