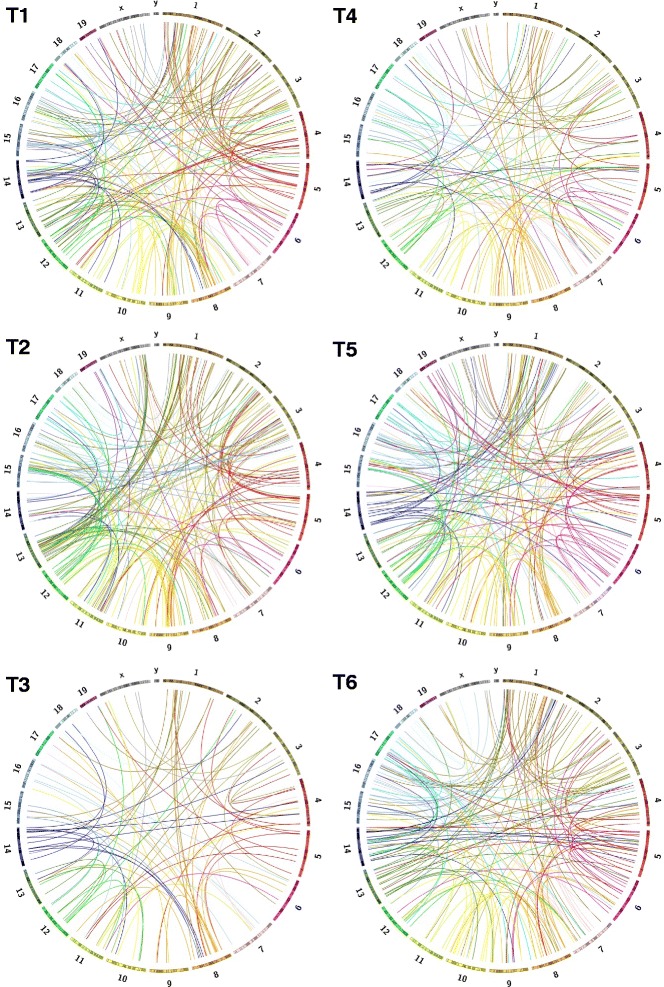
Fig. 1.

Dramatically increased genomic complexity in G1XP lymphomas. All of the unique inter-chromosomal translocation (CTX) events are shown as Circos plots for six sequenced G1XP lymphoma samples. Each color-coded bar represents an individual chromosome with its specific banding patterns shown. Each color-coded line represents a CTX event originating from that particular chromosome
