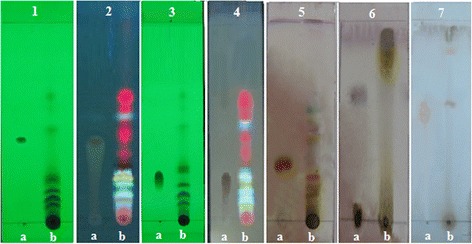
Fig. 1.

Thin layer chromatograms of methanol extract of C. cristata (MECC). Experiment 1- (at 254 nm, a: quercetin, b: MECC), 2-(at 356 nm, a: quercetin, b: MECC) for flavonoids (orange, yellow spots); 3- (at 254 nm, a: gallic acid, b: MECC), 4- (at 356 nm, a: gallic acid, b: MECC) for phenolics (fluorescence blue spots); 5- after spray of 1 % vanillin-H2SO4 reagent (a: stigmasterol, b: MECC) for steroids (purple spots); 6- after spray of H2SO4 (a: digoxin, b: MECC) for glycosides (dark-violet spots); 7- after spray of Dragendroff’s reagent (a: atropine, b: MECC) for alkaloids (light pink spots)
