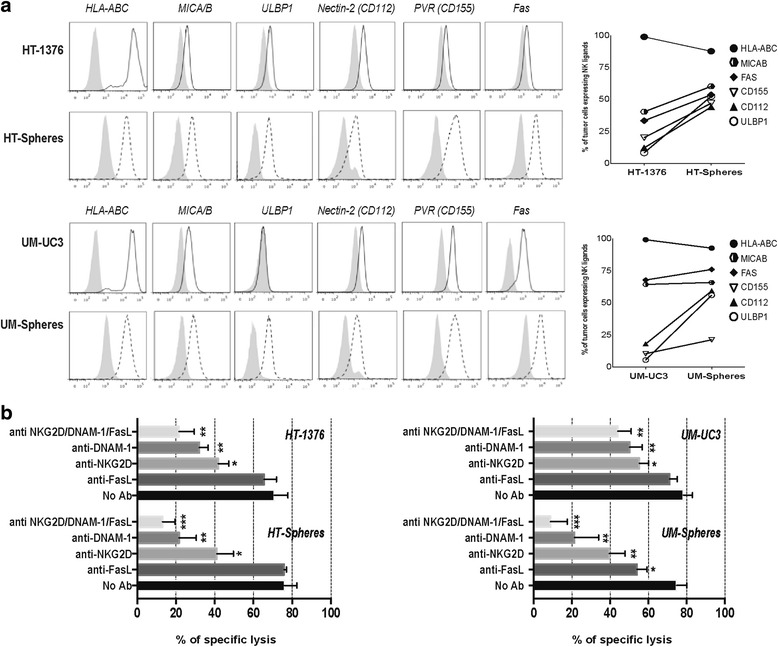
Fig. 2.

Bladder cancer cells express multiple ligands for NK-cell activating receptors. a Representative histograms illustrating the expression of HLA-ABC, CD112, CD155, MICA/B, ULBP-1, and Fas in parental cells (black solid lines) and spheres (black dotted lines). Gray profiles represent isotype-matched controls. The graph represents the mean percentage of each ligand in both cell subsets of three independent experiments. b Percent killing of target cells after 4 h co-culture with NK cells activated for 48 h in the presence of blocking antibodies against NKG2D, DNAM-1, and FasL, separately and in combination. Bar graph represents the mean + SEM (n = 4). *P < 0.05, **P < 0.01, and ***P < 0.001 compared to untreated NK cells
