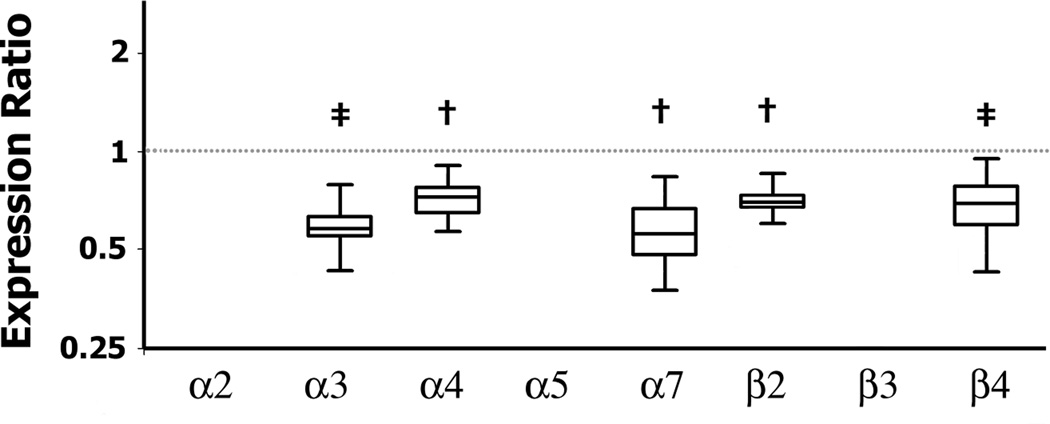
Figure 7. Expression of nicotinic acetylcholine receptor (nAChR) subunits in BTBR mice during embryonic development.
Box plots show median and interquartile range of observations and whiskers represent minimum and maximum observations. P values refer to indicated gene expression ratios of fetal brain comparing BTBR and B6 (shown by the dotted line = 1). Fetal brains were collected from pregnant B6 and BTBR mice on E13. In BTBR fetal brains there were significant downregulation of α3 (p<0.0001), α4 (p=0.004), α7 (p=0.006), β2 (p=0.007), and β4 (p=0.001) nAChR mRNA levels compared to B6 fetuses. N= 5 pooled pregnancies per genotype. * indicates p<0.05, † p≤0.01, and ‡ p≤0.001.

