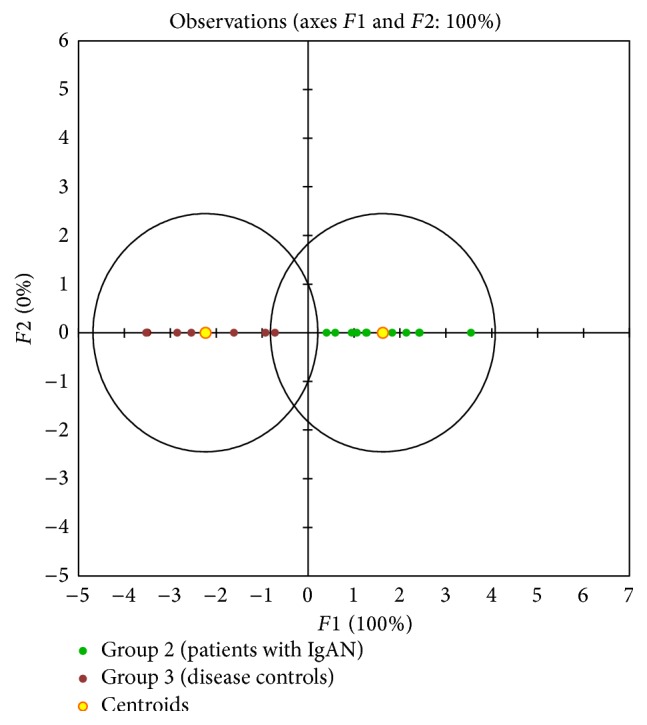
Figure 2.

The graphical output from discriminant analysis for seven urinary markers listed in Box 2 normalized to urinary creatinine (see also Table 5) for the two groups of patients with renal disease. The same discrimination power was found for normalized markers as for nonnormalized. Group 2 (patients with IgAN, green), group 3 (disease controls, red-brown).
