Figure 1.
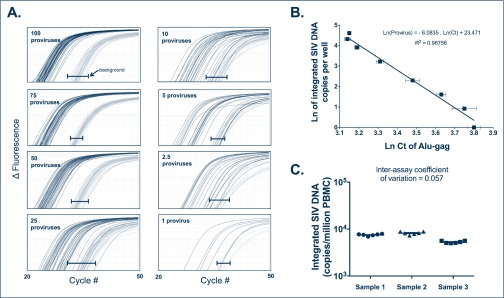
Integration standard curve. The polyclonal integration standard DNA was diluted in uninfected PBMC DNA to a constant amount of 10,000 cell equivalents per reaction. Seven dilutions ranging from 1 to 100 copies per reaction were subjected to our two-step Alu-PCR. (A) The first PCR reaction used primers targeting Alu and gag or only primers to gag. The nested PCR reaction used SIV-specific primers binding to the LTR elements, R and U5. For each dilution sample, Alu-gag and gag-only (background) amplification was measured 42 times. At low proviral copy number, integration is detected at a low frequency as demonstrated by the Alu-gag amplification. For clarity, we did not show the gag-only signals at the lower dilutions, but instead show the bracketed black lines (|—|), which represent where the gag-only signal (background) was detected at each proviral number. (B) The natural log (Ln) of integrated SIV-DNA copy number is plotted on the y-axis against the Ln of the cycle threshold (Ct) of Alu-gag amplification on the x-axis. Each point represents the average Ln(Ct) for 42 replicates and the error bars represent the standard deviation. (C) SIV integration measurements were performed in six independent experiments on PBMC samples from three untreated RM to calculate the inter-assay coefficient of variation of the assay. Horizontal bars show means and standard deviations

