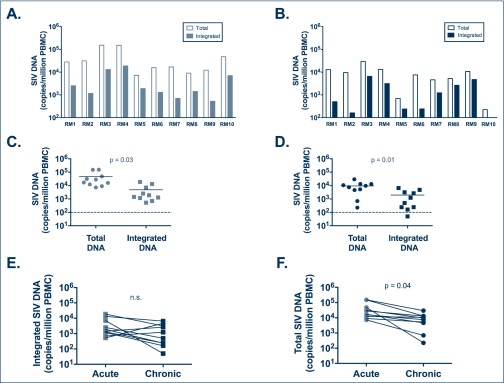
Figure 2.
Total and integrated SIV-DNA levels in untreated SHIV-infected RMs. The Alu-gag PCR was used to quantify integrated SIV-DNA as compared to total SIV-DNA measured by standard gag RT-PCR in 10 RM. PBMC during the acute phase (A,C) and the chronic phase (B,D) of untreated SIV infection. Levels of integrated (E) and total (F) SIV-DNA were also compared between acute and chronic infection. In (C) and (D) lines are drawn at the median

