
Fig. 2.
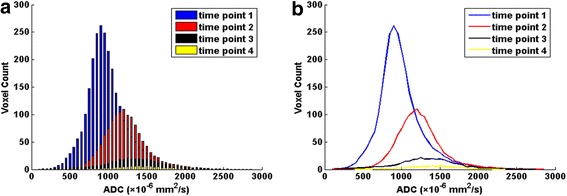
Dynamic changes of the averaged apparent diffusion coefficient (ADC) histogram and the corresponding histogram curve of 32 patients with advanced cervical cancers during concurrent chemo-radiotherapy (CCRT) (with a bin size of 50 × 10−6 mm2/s). a The averaged ADC histogram changes continuously during the course of CCRT. b The corresponding histogram curve gradually moves toward the right and turns into a more symmetrical shape with conspicuous descending peak as treatment continues. time point 1: before CCRT; time point 2: at the end of 2nd week of CCRT; time point 3: at the end of 4th week of CCRT; time point 4: immediately after CCRT completion