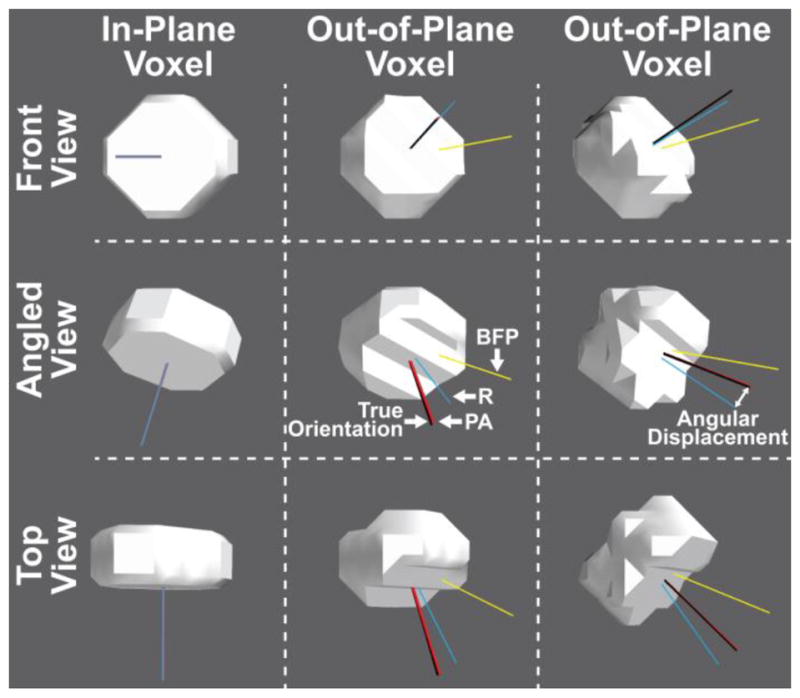
Figure 4.

Simulated electrodes (radius = 2.5 mm, thickness = 2.5 mm) digitized in the same anisotropic CT voxels (0.5 × 0.5 × 0.5 mm resolution), but at different orientations to the voxel plane (left column in-plane, center and right columns out-of-plane) and shown from different angles (rows). The true orientation of the electrode is represented by the black line and the three colored lines represent the orientation calculated by each of the three measures: Best-Fitting Plane (BFP; yellow), RANSAC (R; blue), and Principal Axis (PA; red). The angular displacement between the true and calculated electrode orientation increases when the orientation of the electrode does not match the voxel slice orientation. Nevertheless, the Principal Axis method significantly outperformed the other two measures regardless of electrode orientation. Some overlapping axes are not visible.
