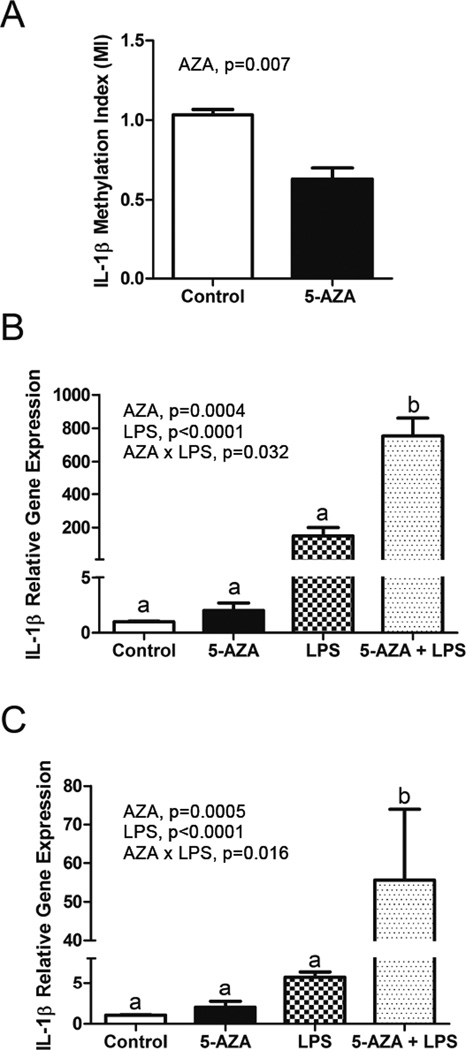
Figure 4. Increased IL-1β gene expression in 5-aza and LPS-treated BV-2 cells coincides with decreased IL-1β promoter DNA methylation.
BV-2 cells were treated with 5-aza for 48 h and/or LPS for 4 or 24 h. Bars represent the mean ± SEM (n = 3–4). A) IL-1β promoter DNA methylation as measured by a Methylation Index (MI). B) lIL-1β mRNA expression after 4h LPS treatment. C) lIL-1β mRNA expression after 24h LPS treatment.

