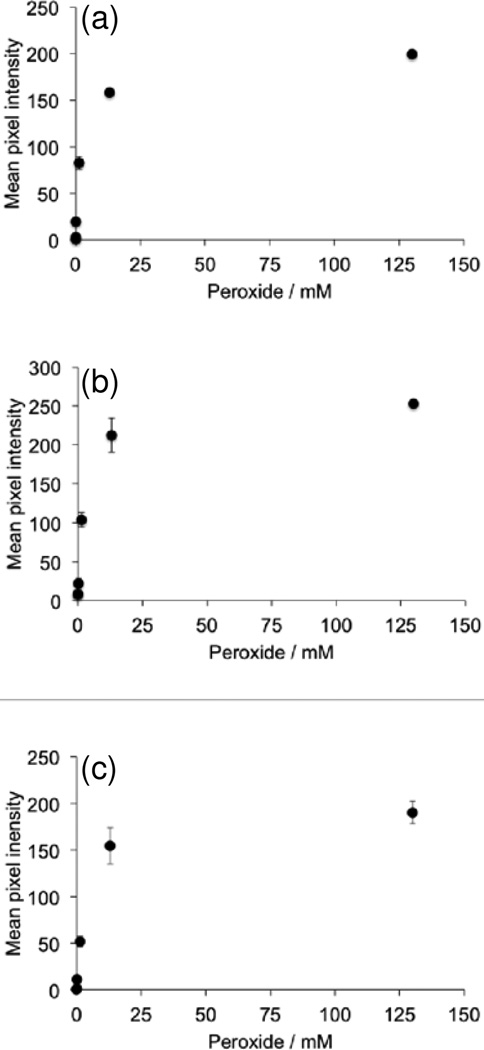
Figure 5.
Quantification of images in Figure 2. Plots of measurements from 25 µL aliquots of 0–130 mM H2O2 (0–10 mM final concentration) versus mean pixel intensity of circular ROIs around the microwells using the reagents (a) 3.9 mM DPA, 3.7 mM imidazole, and 3.1 mM TCPO in 9:1 EtOAc:CH3CN. (b) 3.9 mM rubrene, 3.7 mM imidazole, and 3.1 mM TCPO in 9:1 EtOAc:CH3CN. (c) 3.9 mM BPEA, 3.7 mM imidazole, and 2.2 mM CCPO in 9:1 EtOAc:CH3CN. Images were acquired 2–3 seconds after addition of H2O2. Error bars are ± S.D (n = 3).

