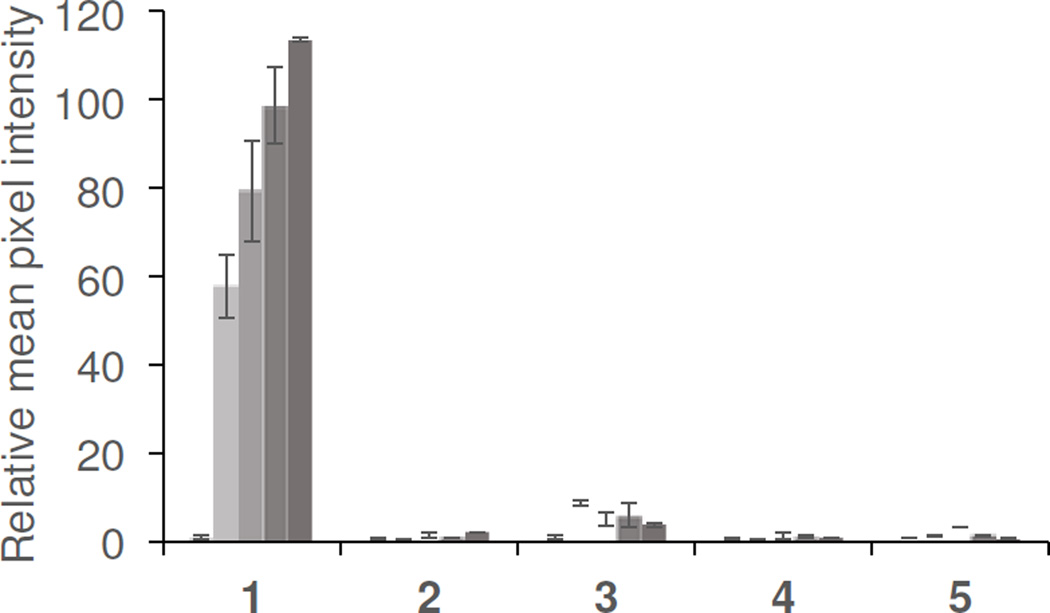
Figure 6.
Selectivity for H2O2. Experiments were performed using 3.4 mM BPEA, 3.2 mM imidazole, and 1.9 mM CCPO in 9:1 EtOAc:CH3CN, and 75 µL aliquots of 0, 25, 50, 100, and 200 µM of (1) H2O2 (2) NO2− (3) tBuOOH (4) HOCl (5) ONOO−. Images were acquired 2–3 seconds after addition of CCPO as the final reagent. Error bars are ± S.D (n = 3) and values are normalized to the blank value for each trial.

