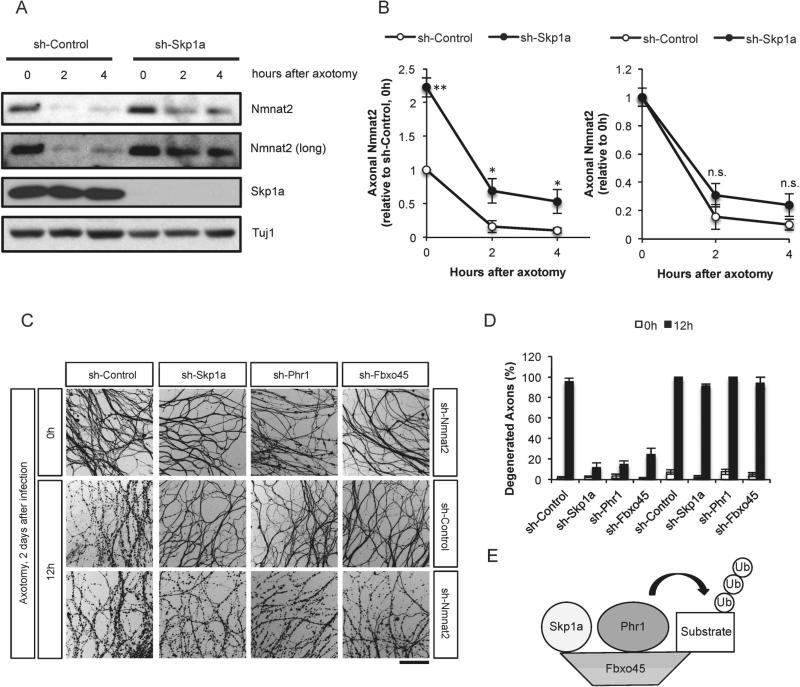
Figure 3. Skp1a functions in axon degeneration via regulation of axonal Nmnat2.
(A) Axonal protein was harvested from control or Skp1a shRNA expressing neurons at indicated time points following axotomy and subjected to immunoblot analysis. (B) Axonal Nmnat2 shown in (A) was quantified at the indicated time points following axotomy using Image-J (n=4 for each condition, *p<0.05, **p<0.01, t-test, bars: ±SD). (C) Axon degeneration of DRG neurons expressing each shRNA was visualized by immunostaining of Tuj1 at the indicated time points after axotomy. Scale bar, 100μm. (D) Axon degeneration shown in (D) was quantified (n=3 for each condition, bars: ±SD).
(E) Schematic model for the Skp1a-Phr1-Fbxo45 complex.

