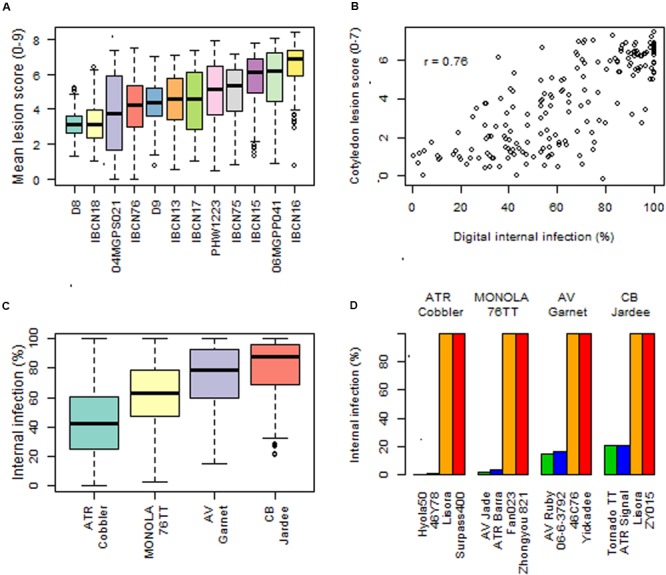
FIGURE 1.

Natural variation for resistance to Leptosphaeria maculans. (A) Box-plots showing genetic variation for race-specific resistance to 12 SSIs in a diverse panel of 179 genotypes of Brassica under the glasshouse conditions. (B) Scatter graph showing relationship between cotyledon lesion and digital internal canker infection scores assessed under field conditions (C) Genetic variation for resistance evaluated at the adult plant stage using ascospore shower test in a diverse panel of 179 genotypes of canola under greenhouse conditions. Black bars represent median values and the colored boxes represent the range of variation in resistance and the error bars represent the outliers. (D) Promising canola genotypes which showed good level of resistance against pathotypes present on stubbles collected from the contemporary Australian canola varieties.
