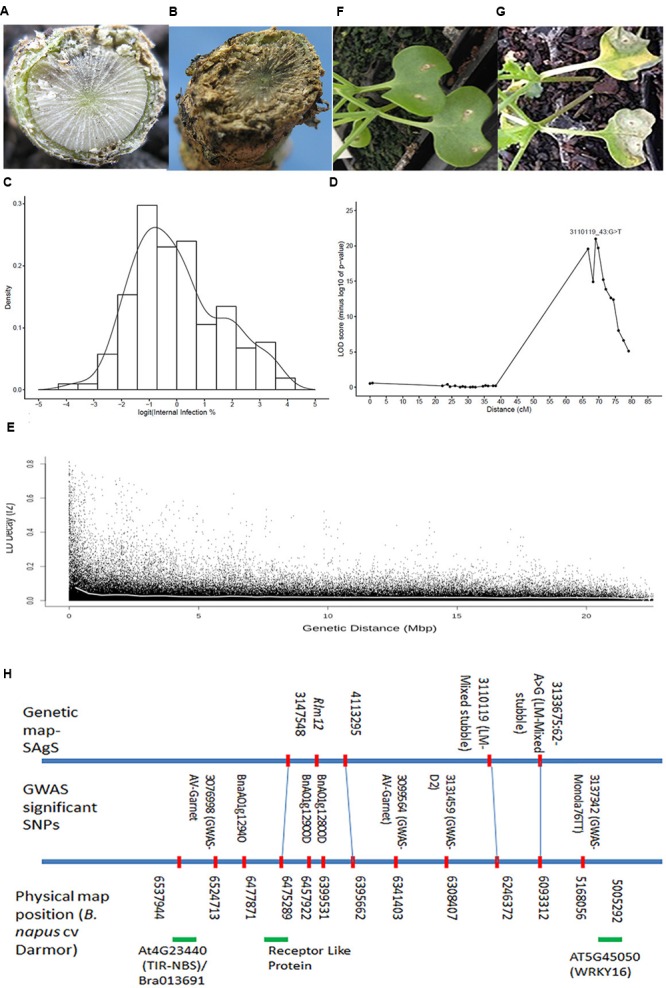
FIGURE 3.

Genetic and physical mapping of Rlm12 locus on chromosome A01 in the SAgSDH population of Brassica napus. Crowns of resistant B. napus cv. Ag-Spectrum (A) and susceptible B. napus cv. Skipton (B) showing canker due to infection of L. maculans pathotypes at the adult plant stage. (C) The frequency distribution of internal infection scores among DH lines from the SAgS cross. The population was scored for resistance at the physiological maturity. (D) A major quantitative trait locus (QTL) showing highly significant association with resistance to L. maculans pathotypes present on mixed stubble. (E) The average LD decay (r2) on chromosome A01 approach 0.029 when distance between SNPs was approximately 200 kb. The curve (shown in white) was drawn across SNPs markers using the non-linear regression model. (F) Cotyledons of Ag-Spectrum and Skipton (G) showing critical symptoms of L. maculans infection after 20 days of inoculation with a single spore isolate 06MGPP041. (H) Alignment of markers that showed significant association with resistance to L. maculans isolates, pathotypes present on different stubbles (ascospore shower screen in a GWAS panel and SAgSDH population) and the reference B. napus genome sequence cv. Darmor.
