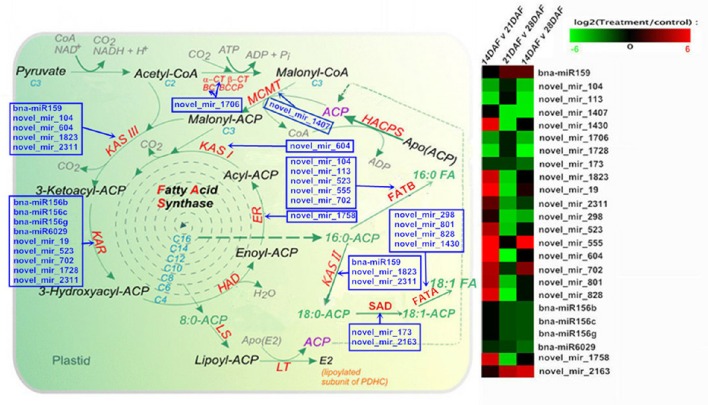
Figure 6.
Analysis of pathways related to acetyl-CoA conversion to fatty acids; the map displays selected steps from KEGG pathways of fatty acid biosynthesis. Colors indicate miRNAs that differed significantly in expression, with red representing up-regulation and green representing down-regulation (the original drawings of fatty acid biosynthesis are from http://aralip.plantbiology.msu.edu/pathways/fatty_acid_synthesis).

