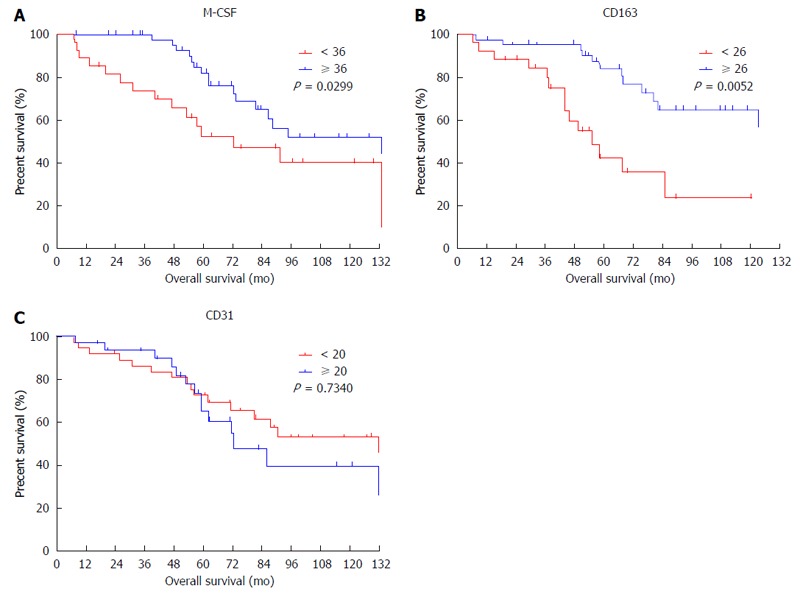
Figure 3.

Cumulative overall survival curves of patients with high or low macrophage colony-stimulating factor expression in peritumoral features. Overall survival curves of patients with high or low expression of macrophage colony-stimulating factor (M-CSF) in peritumoral liver tissues are shown. A: M-CSF; B: CD163; C: CD31. The intratumoral features were not associated with overall survival.
