Figure 1.
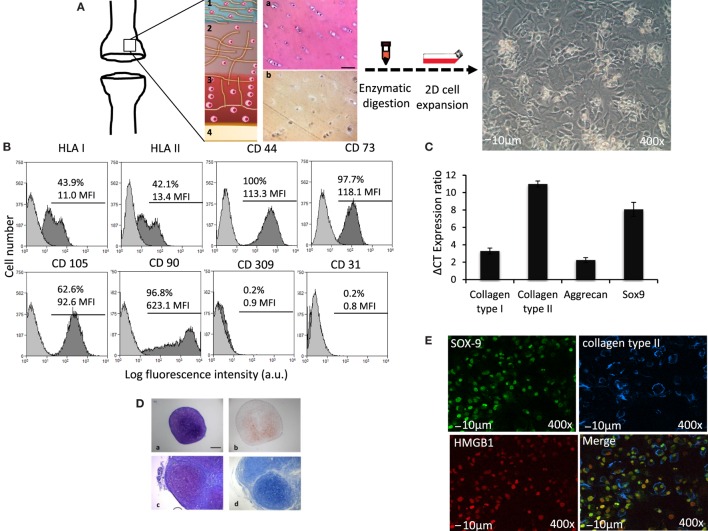
Phenotypic features of hAC. (A) Schematic representation of surgical specimens of articular cartilage (on the left), enzymatic digestion and 2D cell expansion in culture (middle) and images of cultured hAC (on the right). 1, 2, 3, and 4 represent schematically the anatomic architecture of cartilage divided by zones: (1) superficial tangential; (2) middle; (3) deep, and (4) calcified cartilage zone. Histological explants characterization: (a) hematoxylin and eosin and (b) immune detection of collagen type II. (B) Phenotype of hAC assessed by cytofluorimetry with mAbs to the indicated surface molecules (HLA-class I, HLA-class II DR antigens, CD44, CD73, CD105, CD90, CD309, and CD31). Results are shown as log fluorescence intensity vs. number of cells. In each subpanel are shown the negative control (light gray histogram) and the expression of the indicated antigens (dark gray histogram). In each panel are indicated the % of positive cells and their mean fluorescence intensity (MFI) in arbitrary units (a.u.). (C) ΔCT ratio of mRNA expression in cultured hAC of either collagen type I or type II, or aggrecan or sox-9 transcription factor and GAPDH housekeeping gene. (D) Histological staining of 3D pellet culture cross sections. (a,b) In vitro pellet formed by human articular chondrocytes. (a) toluidine blue staining, (b) immunohistochemical expression of collagen type II. (c,d) In vivo subcutaneous implantation of pellets. Pellets were formed by hAC, after 2 weeks in culture, these pellets were then implanted in nude mice. (c) toluidine blue staining, (d) alcian staining. Scale bar = 100 μm. (E) Expression of nuclear Sox9 (green) and extracellular collagen II (blue) on hAC assessed by confocal microscopy. The expression of HMGB1 (red) as a nuclear marker is shown to identify nucleus. The merge image is also shown. Bar = 10 μm. 400× magnification.

