
Figure 1.
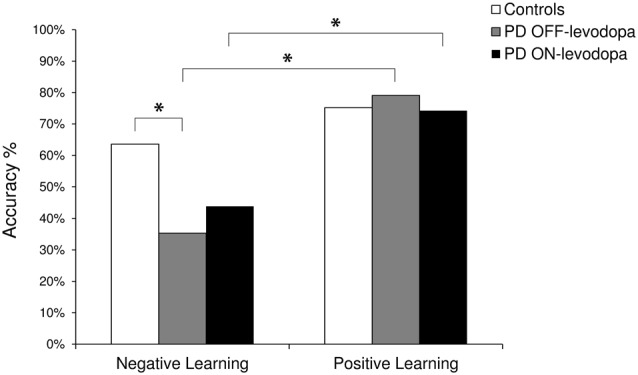
The plot shows the percentage (%) of correct responses in the Testing Phase. Negative Learning = percentage of avoidance of B responses; Positive Learning = percentage of choice of A responses. PD, Parkinson’s disease. *Indicates significant difference (p < 0.05).