. 2016 Oct 24;7:1540. doi: 10.3389/fpls.2016.01540
Copyright © 2016 Camargo, Mott, Gardner, Mackay, Corke, Doonan, Kim and Bentley.
This is an open-access article distributed under the terms of the Creative Commons Attribution License (CC BY). The use, distribution or reproduction in other forums is permitted, provided the original author(s) or licensor are credited and that the original publication in this journal is cited, in accordance with accepted academic practice. No use, distribution or reproduction is permitted which does not comply with these terms.
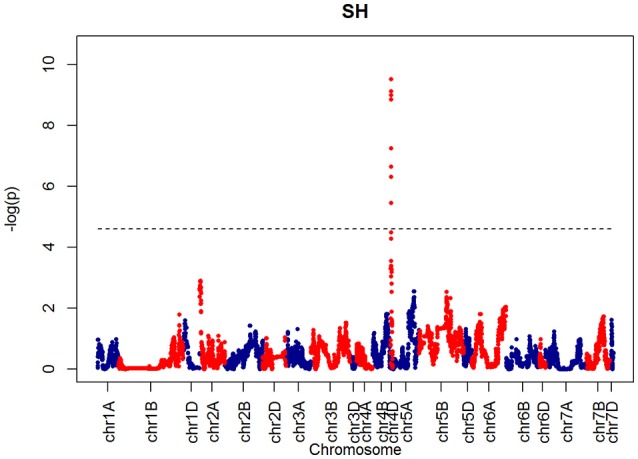
Figure 10.

QTLs markers for the trait SH. Dashed lines indicate threshold (FDR < 0.05, logP4).
