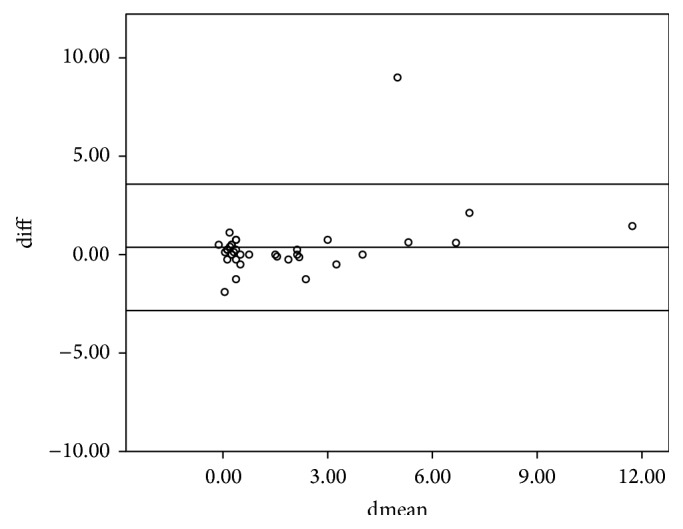
Figure 1.

Bland-Altman plots comparing refractive measurements between autorefraction and retinoscopy (spherical equivalent). Difference between the measurements (diff) is plotted on the vertical axis, and their mean is plotted on the horizontal axis (dmean). The middle horizontal line represents the mean difference and the two horizontal lines, one above and the other below, are the 95% limits of agreement between measurements.
